| | Description | Data sources | Potential uses | Limitations | Further information | Download spatial information
Description
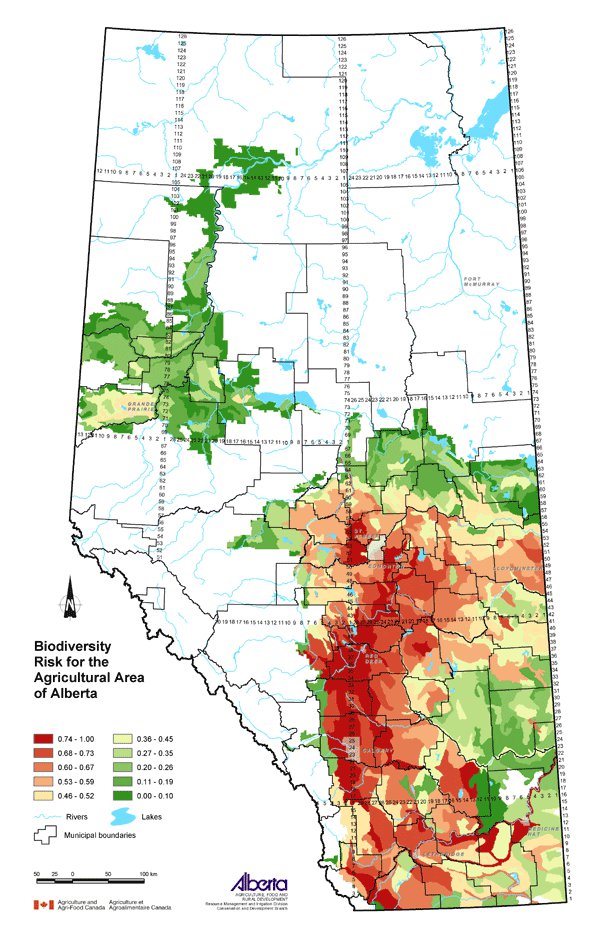
This map displays an assessment of biodiversity risk for the agricultural area of Alberta. Biodiversity risk refers to the loss of biological diversity, or the variety of plant and animal life in agricultural landscapes. This decrease in biodiversity is believed to affect the overall health of the environment. A diverse ecosystem is better able to respond to environmental changes or stresses, such as floods, drought, pests and disease. The goal of maintaining biodiversity in agricultural landscapes may be more readily attained through prevention of further losses in areas less impacted by agriculture rather than through efforts to restore biodiversity in more heavily impacted areas. Information about physical features that affect biodiversity was combined with economic information on agricultural activities that show how human activity affects biodiversity. The classes formed as shown on the map were ranked from 0 (lowest risk) to 1 (highest risk).
Data Sources
A physical description of biodiversity was provided by four spatial databases regarded as acceptable surrogates on the subject:
- Density of upland habitat - estimated from the landuse / landcover map prepared by Prairie Farm Rehabilitation Administration (PFRA) for the Western Grain Transportation Payments Program. For each Soil Landscapes of Canada (SLC) polygon, the percentage of land classified as trees, shrubs or grasslands was considered "upland habitat."
- Density of wetland habitat - estimated from the Ducks Unlimited Canada (DUC) wetland database. For each SLC polygon, the percentage of land identified as wetlands was considered "wetland habitat." The database used satellite imagery acquired in early to late May from 1982 to 1987. Imagery from the month of May was used to capture spring conditions at their wettest.
- Density of waterways - reported in linear kilometers per square kilometer of land in each SLC and used as a surrogate for riparian area density. Linear waterways were identified from the Alberta government's Base Features Single Line Network map (1: 20 000 scale).
- Species at risk - the number of natural habitat areas of species at risk, which overlap at any given location in the landscape, was used as a surrogate for the density of species at risk at that location. "Species at risk" is a term used by the Committee on the Status of Endangered Wildlife in Canada (COSEWIC) that includes plant and animal species that are either extirpated, endangered, threatened or a species of special concern. Individual COSEWIC 2002 Species Range Maps were downloaded from the COSEWIC website.
These four maps were converted to a 0 to 1 ranking and spatially added together with the wetland density index given a double weighting. A physical factors map with a range of values from 1 to 6 was the result.
While all human activity impacts biodiversity, the more geographically concentrated the activities are, the more biodiversity is impacted. Total economic activity by region was used as a surrogate for agricultural impact on biodiversity. An Economic Activity Index was calculated from 2001 Census of Agriculture data as the sum of total capital value, gross sales and total expenses for all farms in a SLC polygon, normalized to a per-area basis and ranked from 0 to 1. The Economic Activity Index was multiplied by the biodiversity physical factors map and the result ranked from 0 to 1 to form the biodiversity risk factor for each SLC polygon as displayed on the map.
SLC Version 1.9 was used for this map. SLC polygons were created using existing soil survey information. Each polygon is described by a standard set of soil and land attributes that characterizes the soil landscapes found in each SLC polygon. Soils, landscapes and climate are the key natural resource factors that determine agricultural productivity, and the farms within a soil landscape unit usually have similar production characteristics.
Potential Uses
Biodiversity risk is a complex issue, but this map tries to show where biodiversity could be threatened, such as in areas with significant habitat that coincide with areas of greater agricultural economic activity. Agriculture has a significant influence on biodiversity because of its occurrence over a large portion of the landscape, the management intensity associated with modern methods of farming and the effects that some management practices have beyond the target area. However, agricultural land can play a positive role in the maintenance of biodiversity, especially in areas where there are competing and more disruptive land uses, such as urbanization. Conservation efforts can be enhanced by the adoption of management practices that encourage the integration of wild species within agricultural landscapes. The preservation of non-crop habitats is important to the conservation potential of the agricultural lands. Sustainable farming can integrate the interests of agriculture and wildlife.
Limitations
In order to get an accurate as possible picture of biodiversity in the agricultural area of Alberta, data from a number of sources was used, and all were surrogates to determine the best possible physical description of biodiversity in Alberta. As well, data on the agricultural activities was based on economic activity as the best representation of human impact on biodiversity, although it is understood that not all activities will have an equal impact on biodiversity. The methodology can be applied at the landscape and regional level but is not useful at the farm level. Landowners can locate their own property on the map and identify the potential relative risks, but then must assess and evaluate their own conditions and determine the beneficial management practices (BMPs) to address the risk.
Further Information
Alberta Environmentally Sustainable Agriculture program provides information about agricultural biodiversity. From the Alberta Agriculture and Food website, use the topic bar on the left and follow: Soil/Water/Air, Environmental Stewardship and Biodiversity. www.agric.gov.ab.ca
COSEWIC www.cosewic.gc.ca
Ducks Unlimited Canada www.ducks.ca
2001 Census of Agriculture website expands on the use of the data collected. www.statcan.ca/english/agcensus2001
Canadian Soil Information System (CanSIS) provides soils information and data including information about SLCs. From the CanSIS website under Data, click on Soil Landscapes on the left side topic bar. http://sis.agr.gc.ca/cansis
Click on map for larger view
Download Spatial Information
Agricultural Land Resource Atlas of Alberta - Biodiversity Risk for the Agricultural Area of Alberta
|
|