| | Description | Data sources | Potential uses | Limitations | Further information | Download spatial information
Description
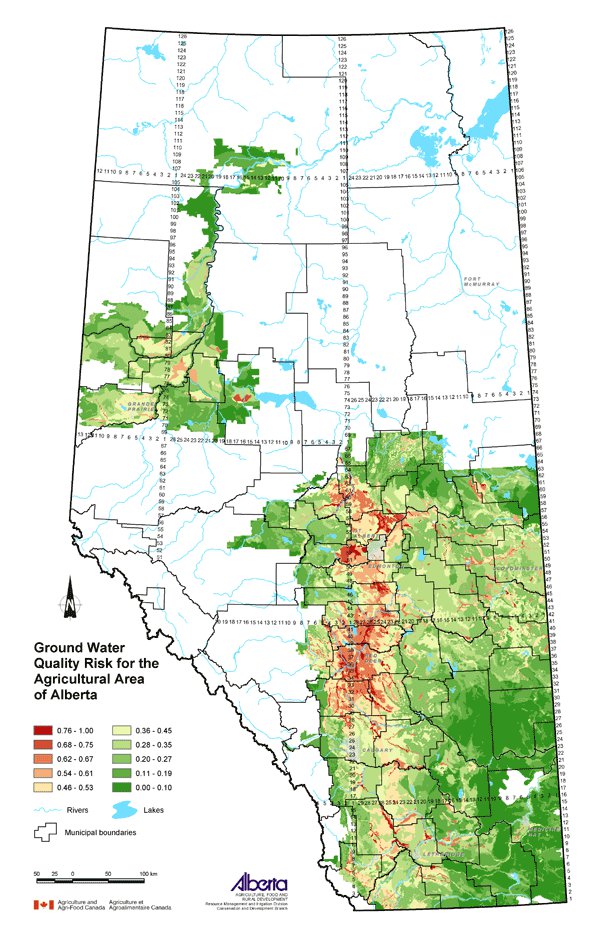
This map displays an assessment of groundwater quality risk for the agricultural area of Alberta. Agricultural activities that may have an impact on groundwater quality include livestock, crop production and agrochemical use. These activities along with the physical characteristics represented by aquifer vulnerability and available moisture were combined to produce this map. The classes shown on the map were ranked from 0 (lowest risk) to 1 (highest risk).
Data Sources
To assess groundwater quality risk, the aquifer vulnerability, aridity and agricultural intensity were specifically considered. Soil Landscapes of Canada (SLC) Version 1.9 was used for this map. SLC polygons were created using existing soil survey information. Each polygon is described by a standard set of soil and land attributes that characterizes the soil landscapes found in each SLC polygon. Soils, landscapes and climate are the key natural resource factors that determine agricultural productivity, and the farms within a soil landscape unit usually have similar production characteristics.
Physical vulnerability of aquifers varies from location to location in Alberta and is represented by the Aquifer Vulnerability Index (AVI) prepared by Prairie Farm Rehabilitation Administration (PFRA) and Alberta Agriculture and Food (AF) (Dash and Rodvang, 1999 and Cowen and Dash, 2003). The AVI ranks aquifer vulnerability in four classes, based on surficial geology and depth to aquifer. Aquifers in areas with a higher mean annual precipitation minus potential evapo-transpiration (P-PE) value are considered to be more susceptible to contaminants through leaching to the groundwater. P-PE values were obtained from the National Ecological Framework for Canada ecodistrict climate files. Aquifer vulnerability classes were combined with P-PE ratings to create the groundwater physical sensitivity factor.
The components used in the Agricultural Intensity Index (AII) were each derived in different ways from the 2001 Census of Agriculture data. Manure production was calculated from Census data collected about the numbers of all livestock raised in the province. Using research by Culley and Barnett (1984), Statistics Canada calculated the amount of manure produced by the total number of livestock. A formula that weighted the different livestock based on animal size and average manure output was used. The numbers of each type of livestock reported in the Census, multiplied by its manure factor, were totalled to give the total manure produced in tonnes.
The AII was developed through the AESA Water Quality Monitoring Program and work done by Johnson and Kirtz (1998) and by Anderson, Cooke and MacAlpine (1999). The AII is the relative ranking of the sum of the rankings of watersheds by each of manure production, fertilizer use and agrochemical use, per unit area, based on 2001 Census of Agriculture data. For this process, SLC polygons, and not watersheds, were used to integrate agricultural inputs. Calculation and custom processing of the Census data by Statistics Canada yielded manure production (tonnes), fertilizer expense ($) and agrochemical expense ($) for each SLC polygon. These values divided by the SLC polygon area (square km) resulted in a ratio per unit area for each of manure, fertilizer and agrochemicals, which were totalled to give the AII rating. The AII rating was multiplied by the groundwater physical sensitivity factor described previously, and the resultant values were ranked from 0 to 1, to give the groundwater quality risk factor as displayed on the map for each SLC polygon.
Potential Uses
The groundwater quality risk is an indication of where the groundwater quality may be impacted by leaching of contaminants.
Limitations
This map displays groundwater quality risk at a regional level. Landowners can locate their own property on the map and identify the potential relative risks, but then must assess and evaluate their own conditions and determine the appropriate beneficial management practices (BMPs) based upon their site-specific knowledge.
Further Information
Information about groundwater vulnerability and the AESA Water Quality Monitoring Program can be found at the AF website.
Canadian Soil Information System (CanSIS) provides soils information and data including information about SLCs.
2001 Census of Agriculture website expands on the use of the data collected.
Groundwater Assessment Reports available from PFRA provide information on the yield, quality and depth of aquifers in Alberta.
Anderson, A., S. Cooke, and N. MacAlpine. 1999. Watershed Selection for the AESA Stream Water Quality Monitoring Program. Alberta Environmentally Sustainable Agriculture, AF.
Ecological Stratification Working Group. 1995. A National Ecological Framework for Canada. Agriculture and Agri-Food Canada, Research Branch, Centre for Land and Biological Resources Research and Environment Canada, State of the Environment Directorate, Ecozone Analysis Branch, Ottawa/Hull. Report and national map at 1:7 500 000 scale.
Cowen, T. and Dash, T. 2003. Groundwater Vulnerability Map of Northern Alberta. PFRA, unpublished.
Culley, J.B. and Barnett, G.M. 1984. Land Disposal of Manure in Province of Quebec. Cdn. Journal of Soil Science. 64:75-86.
Dash, T. and Rodvang, J. 1999. Draft Approach to the Preparation of Groundwater Vulnerability Maps for the Oldman Basin Water Quality Initiative. PFRA and AF.
Johnson, I. and Kirtz, J. 1998. Agricultural Intensity in Alberta, 1996 and Changes Since 1991. Alberta Environmentally Sustainable Agriculture, AF.
Click on map for larger view
Download Spatial Information
Agricultural Land Resource Atlas of Alberta - Groundwater Quality Risk for the Agricultural Area of Alberta
|
|