| | Description | Data sources | Potential uses | Limitations | Further information | Download spatial information
Description
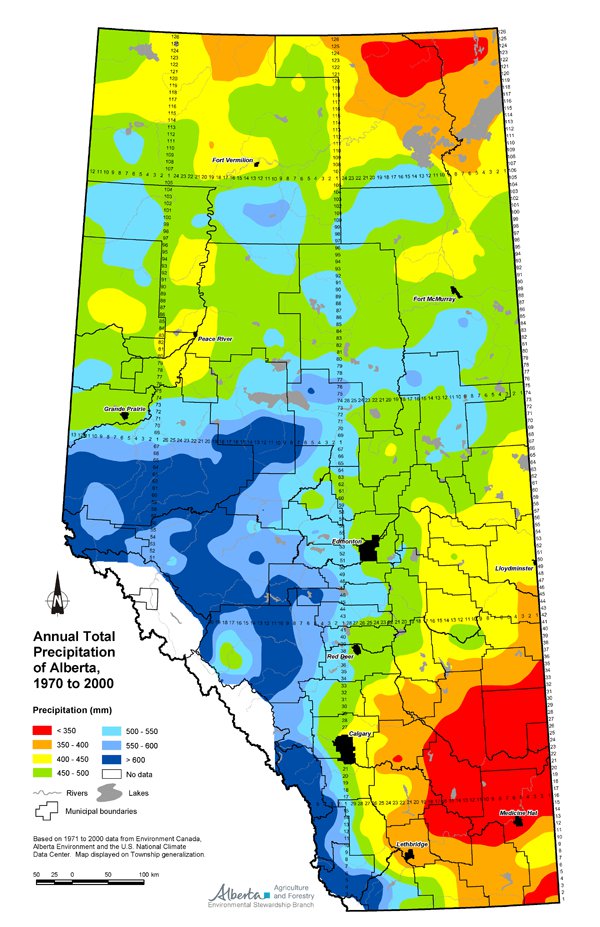
This map describes the annual total precipitation in Alberta for the 30-year period 1971 to 2000. A 30-year period is used to describe the present climate since it is enough time to filter out short-term fluctuations but is not dominated by any long-term trend in the climate.
Annual total precipitation refers to rain, snow and other forms of moisture such as hail. Annual precipitation in Alberta is greatest in the mountains and decreases at lower elevations. In the agricultural areas of the province, 50 to 60 percent of annual precipitation generally occurs during the growing season, mostly as rain.
The map shows precipitation in mm according to the following classes: less than 350, 350 to 400, 400 to 450, 450 to 500, 500 to 550, 550 to 600 and greater than 600.
Data Sources
Annual Total Precipitation of Alberta, 1971 to 2000, is found in the Agroclimatic Atlas of Alberta, 1971 to 2000 (Chetner and the Agroclimatic Atlas Working Group, 2003). This map was based on 1971 to 2000 data from Environment Canada, Alberta Environment and the United States National Climate Data Center. These agencies collect data from over 1200 climate stations in Alberta and 1400 stations in neighboring provinces, territories and states. The stations collect daily temperature and precipitation information. Environment Canada receives the majority of the data from the federal and provincial networks and performs quality control on the data. Data from the United States stations is provided by the U.S. National Climate Data Center.
Precipitation data collected at climate stations was interpolated between stations and rolled up to a township. In order to avoid the blocky appearance of townships on the map, a township generalization was produced using smoothing procedures of computer graphics software for final presentation on the map.
Potential Uses
Precipitation in any month can be extremely variable with the variability of precipitation being greater in southern Alberta than in the Peace River Region and central Alberta. However, long-term (30-year) data provides a reliable indication of what to expect in any given location.
Climate information is used as a long-term planning tool, for example, in selecting a location for a farm or planning a cropping program. Crop producers generally look at the most likely weather conditions rather than the extremes because the key inputs and decisions are made well in advance of achieving results. By combining knowledge of the agricultural operation with knowledge of what is likely to happen, the producer can then decide on the acceptable level of risk due to adverse conditions.
Limitations
The township generalization used in the map smoothes the look of the data, but townships between recording stations may have slight variations from what is shown on the map.
Further Information
The Agroclimatic Atlas of Alberta, 1971 to 2000, is available online at the Alberta Agriculture and Food (AF) website by using the topic bar at the left and following Weather & Climate and then Agroclimatic Atlas.
Chetner, S. and the Agroclimatic Atlas Working Group. 2003. Agroclimatic Atlas of Alberta, 1971 to 2000. AAFRD. Agdex 071-1. Edmonton, Alberta.
Download Spatial Information
Click on map for larger view

Agricultural Land Resource Atlas of Alberta – Annual Total Precipitation of Alberta, 1971 to 2000
The Map and links below have been superseded by the Map and links above:

|
|