| |
Healthy lifestyles, consumers’ interest in knowing where their food comes from and how it is produced have all served to increase the demand for locally produced food.
Other consumer values driving this trend are assessing quality, nutrition and food safety, as well as economic and environmental impacts. In this article, we look to understand the consumer trend for local food in the global and domestic market with a special emphasis on Alberta.
Individuals and organizations define local food based on their social, environmental and
economic aims, as well as practical considerations such as availability.
According to Agriculture and Agri-Food Canada (AAFC), consumers generally define local food as food
coming from a region smaller than a province. However, the region they perceive as local may cross
provincial or even national boundaries.
Figure 1: How Consumers Define Local Food. (Percentage of respondents; n=3144)
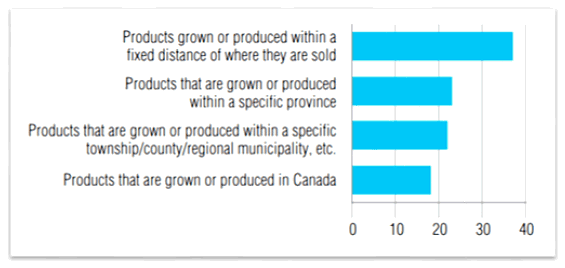
Source: Agriculture and Agri-Food Canada, The Canadian Consumer, 2010
A number of consumer studies found that the main reasons behind the local food trend included a demand for fresh and quality food and the desire to support local economies or farmers.
Local Foods - Global Trends
Consumers around the world care about the origin of food products. Recent Nielsen research found that when it comes to fresh foods, local brands are the clear favourite. This preference can be attributed to perishability and quality dimensions that form the main selection criteria, which increase the likelihood of preference for products that are produced or manufactured close to the source of purchase.
Table 1: Preference of Local Brands to Global Brands
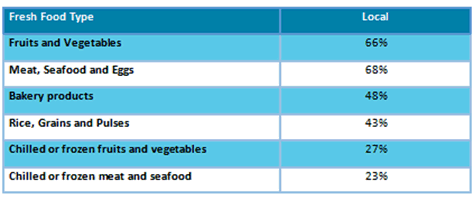
Source: The Nielsen Company (U.S). Made in Matters or Does it? 2017
As illustrated in the figure below, one noteworthy observation from this survey is, the North American consumers’ preference for local fresh categories are less than the global average.
Figure 2: Consumer Preference for Local Brands
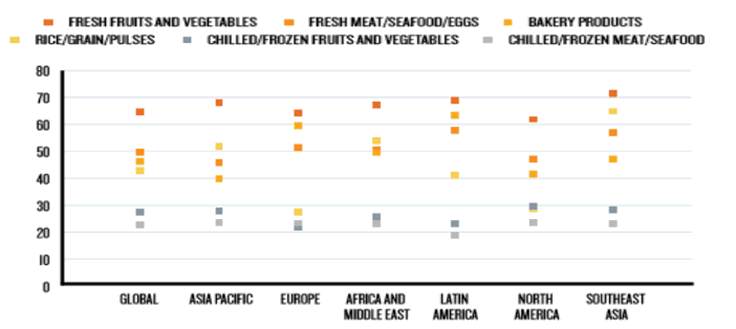
Source: Nielsen Global Brands Origin Survey 2017
Local Foods - Domestic/Canadian Trends
Available research at the provincial level1 indicates that local food sales, through direct marketing channels, have increased over the years. Some retail market trends for local food in Canada are available from Nielsen Canada. Nielsen research indicates that in the fresh food and dairy categories, consumers show a strong preference for local brands. However, in most of the other categories, there is a growing shift towards a preference for global brands.
Source: Canadian Grocer, February 2018

Local Food—Alberta Trends
The local food market in Alberta can be divided into three major marketing categories: Direct Marketing,
Retail Marketing and Food Service Marketing.
Direct Marketing: The Explore Local Section of Alberta Agriculture and Forestry (AF) has been
delving into local food trends by conducting a consumer demand study, every four years. This study
estimates that food purchased at farmers’ markets reached $924.5 million in 2016. This is a 27.7 per cent
increase over the purchases made in 2012. Similarly, in 2016, food purchased from farm retail and
restaurants serving local food were estimated at $303.7 million and 395.6 million respectively. According to this study, Alberta consumers are purchasing local food at farmers’ markets, farm retail and restaurants
serving local food. In 2016, these market channels exceeded $1.5 billion in food sales, of which, the average household food expenditure was $2,341 — almost one-quarter of the overall household food expenditure.
Figure 4: Estimated Value of Food Purchased at Direct Marketing Channels in Alberta, 2004 to 2016
 Source: Alberta Agriculture, Study of Local Food Demand in Alberta, 2016 Source: Alberta Agriculture, Study of Local Food Demand in Alberta, 2016
Retail Marketing: Nielsen Canada recently undertook a study to identify “Alberta Made” food sold through major retail grocery stores in Alberta. This data set included only those products with a Universal Product Code (UPC), which also known as a barcode. Therefore, fresh meat and produce without a UPC barcode are not included in this data.
In this study, Nielsen identified a group of products called the ‘Closed Group’ and this group included Food and Beverage categories that have at least one item with an Alberta claim2.. The sales value of the total Closed Group was $5.57 billion, in the year ending February 2018. Food products worth $518.7 million carried some sort of an Alberta claim.
Analysis of the data set revealed that the value of the total sales of “Alberta Made” food products with a UPC barcode is close to $328 million dollars for the same year (Figure 5). Although “Alberta Made” is about 3.3 per cent of the total retail food sales in Alberta ($9.94 billion), year-over-year (YOY) growth is about 11 percent.

Figure 5: Alberta Made Food as Compared to Total Grocery Sales, Year Ending February 2018
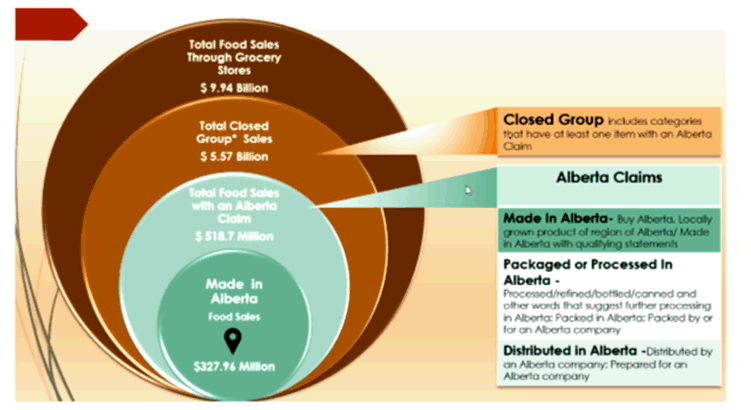 Source: Compiled by Economics and Competitiveness Branch, AF with Nielsen Data 2018 Source: Compiled by Economics and Competitiveness Branch, AF with Nielsen Data 2018
Figure 6: Percentage of Alberta Made Food in Five Major Categories, Year Ending February 2018
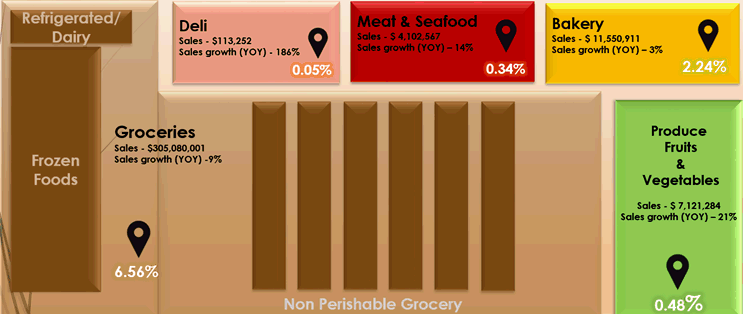
Source: Compiled by Economics and Competitiveness Branch, AF with Nielsen Data 2018
Food Service Marketing: Agriculture and Forestry’s Consumer Demand For Local Food study estimated consumer spending at $395.6 million in 2016 on restaurants serving local food in Alberta. Another study done by Technomic Canada used a different approach to estimate the value of local food used by the food service sector. Technomic conducted a survey of 100 food service operators in Alberta to estimate the total value of local food or Alberta made food sourced by various types of establishments. According to this study, the total value of Alberta made food and beverages purchased by food service establishments in Alberta is estimated at $1.06 billion in 2017.
Figure 7: Alberta Made Foods & Beverages Sourcing As Compared to Total Food & Beverages Sourcing by Alberta Operators
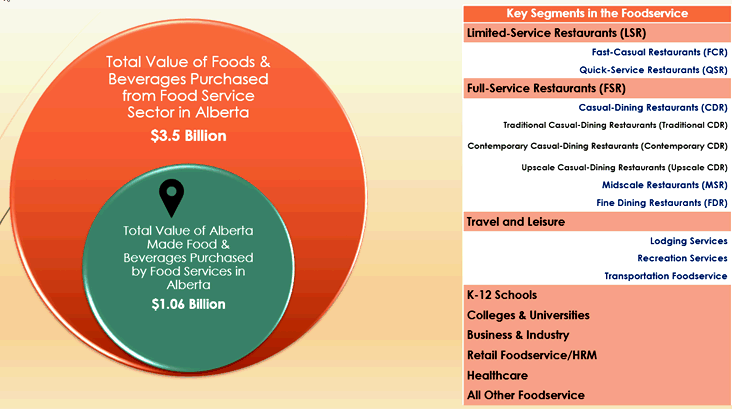
Source: Compiled by Economics and Competitiveness Branch, AF with Nielsen Data 2018
Technomic’s operator survey also estimated the Alberta made food and beverage sourcing, by operator segment and by product category. It was discovered that local food is largely sourced by full service restaurants (Figure 8). When it comes to product category, close to 72 per cent include Alberta made beef, dairy and chicken (Figure 9).
Figure 8: AB Made Foods & Beverage Sourcing By Foodservices - By Operator Segment
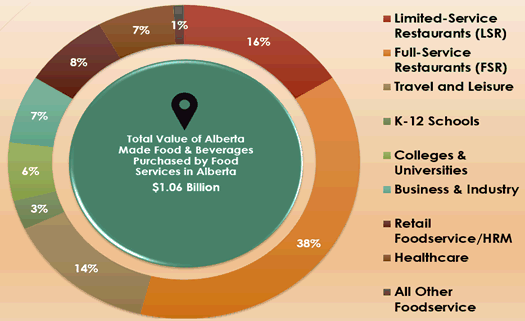
Source: Compiled by Economics and Competitiveness Branch, AF with Nielsen Data 2018
What does it mean?
- Backed by consumer demand for freshness, transparency and desire to support local economies have transformed local food from a foodie movement into an established and more mainstream market.
- Consumer purchase data, along with retail sales data and food service operator survey data all provide evidence that the local food market is growing in Alberta.
- Research findings that include retail sale values for local food categories, their Y-O-Y growth, as well as food service sector operator local food sourcing values, will help Alberta food producers and processors to better understand market opportunities and develop or align their business strategies.
Figure 9: AB Made Foods & Beverage Sourcing By Foodservices - By Product Categories
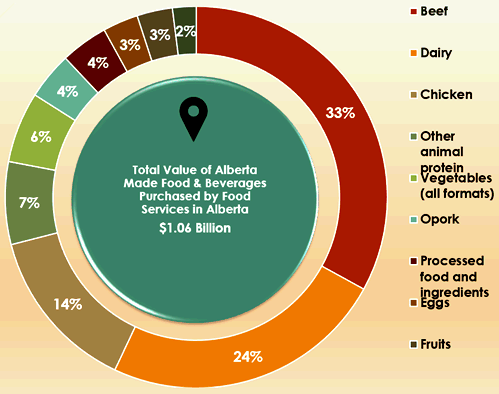
Source: Compiled by Economics and Competitiveness Branch, AF with Nielsen Data 2018
Reference:
· Agriculture and Agrifood Canada. The Canadian Consumer: Behaviour, Attitudes, and Perceptions Toward Food Products. Ottawa: AAFC, May 2010. www.gov.mb.ca/agriculture/statistics/food/ canada_consumer_report_en.pdf.
· Canadian Grocer, February 2018, http://publications.virtualpaper.com/canadiangrocer/cg01/#16/
· Alberta Agriculture and Forestry. 2016. Study of Local Food Demand in Alberta
· The Nielsen Company (US). Made in Matters or Does it? 2017
· The Nielsen Company. 2017. Global Brands Origin Survey
· The Nielsen Canada. 2018. Alberta Made Food Sales.: Origin Label Scan Study
· Technomic Canada. 2018. Alberta Local Foodservice Market Map: Foodservice Assessment and Review of Local Claim |
|