| | In the 1990's, Alberta Agriculture partnered with interested counties to map visible salinity from aerial photographs and other sources of data. The following image shows the counties that have reports and maps available. Much of the original printing has been distributed. You can now either read the report online or download a PDF document. The salinity map of the county has been tiled into convenient letter sized page formats. You can download the map for the area of interest.
Caveats
- The method of mapping salinity used in these reports and maps relied heavily upon air photo interpretation. Field visits were done to verify what was seen on the air photos in order to strengthen the interpretations. Thus, it is a map of visible salinity. It is like looking at an iceberg – there is a lot below the surface that we don’t see. The extent and intensity of below ground salinity is not shown in these maps.
- These mapping projects were done in the mid 1990s. The air photos used were as recent as possible but you should consider these maps and reports as a snapshot of how salinity looked in 1990.
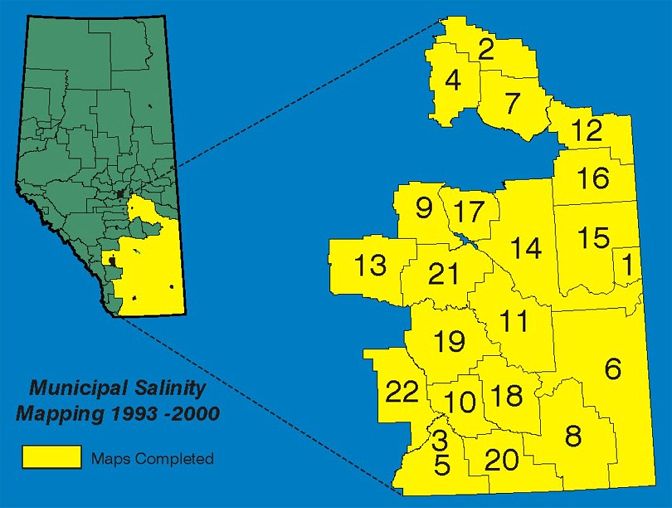
| Ref. No. | Online Summary | PDF Report | PDF Map (instructions below) |
| 1 | Acadia | Acadia (559kb) | Acadia (1,464kb) |
| 2 | Beaver | Beaver (625kb) | Beaver (2,091kb) |
| 3 | Blood Indian Reserve | Blood Indian Reserve (638kb) | Blood Indian Reserve (2,093kb) |
| 4 | Camrose | Camrose (648kb) | Camrose (2,270kb) |
| 5 | Cardston | Cardston (453kb) | Cardston (3,071kb) |
| 6 | Cypress | Cypress (713kb) | Cypress (4,785kb) |
| 7 | Flagstaff | Flagstaff (623kb) | Flagstaff (1,710kb) |
| 8 | Forty Mile | Forty Mile (660kb) | Forty Mile (2,165kb) |
| 9 | Kneehill | Kneehill (631kb) | Kneehill (2,657kb) |
| 10 | Lethbridge | Lethbridge (620kb) | Lethbridge (1,981kb) |
| 11 | Newell | Newell (640kb) | Newell (3,010kb) |
| 12 | Provost | Provost (649kb) | Provost (2,628kb) |
| 13 | Rocky View | Rocky View (468kb) | Rocky View (1,900kb) |
| 14 | Special Area 2 | Special Area 2 (630kb) | Special Area 2 (3,409kb) |
| 15 | Special Area 3 | Special Area 3 (624kb) | Special Area 3 (2,498kb) |
| 16 | Special Area 4 | Special Area 4 (631kb) | Special Area 4 (2,174kb) |
| 17 | Starland | Starland (629kb) | Starland (2,149kb) |
| 18 | Taber | Taber (643kb) | Taber (2,230kb) |
| 19 | Vulcan | Vulcan (779kb) | Vulcan (2,020kb) |
| 20 | Warner | Warner (631kb) | Warner (2,435kb) |
| 21 | Wheatland | Wheatland (717kb) | Wheatland (2,594kb) |
| 22 | Willow Creek | Willow Creek (718kb) | Willow Creek (1,676kb) |
Instructions for PDF Maps
Map automatically opens in Acrobat Reader.
- The entire map can be printed on letter-sized paper.
- You can zoom into any close-up view of a portion of the map, then in your print dialogue window, select "current view" to only print that enlarged view.
- By clicking on the legend heading, you will zoom into the legend page which can be printed separately from an enlarged map view.
|
|