| | Canada and Alberta food trade with the U.S. on the eve of NAFTA renegotiations | Alberta’s top exports and imports with U.S. by product | Retail landscape in Alberta and Canada | Data highlights | Sources
.
Canada and Alberta Food Trade with the U.S. On the Eve of NAFTA Renegotiations
On the eve of the renegotiation of the North American Free Trade Agreement (NAFTA), this section looks at the food trade between Canada and the U.S. with special emphasis on Alberta. Trade with the U.S. is facilitated by proximity, common culture, language, similar lifestyle pursuits and the ease of travel among citizens for business and pleasure. Both Canadian and U.S. products have an increased competitive edge over goods from other countries as a result of NAFTA. The elimination of import duties under the trade agreement has resulted in significant gains for both Canadian and U.S. food companies.
Canada and the U.S. maintain the world’s largest bilateral trading relationship. According to the United States Department of Agriculture (USDA), in 2016, Canadian agricultural imports surpassed US $20 billion. About US $16 billion or nearly 80 per cent of these imports were comprised of high-value consumer food products (HVP). As their top global market, Canada accounts for over one-fourth of all U.S. HVP food exports, double the value of their second leading market, Mexico, or equal to the combined Asian markets of Japan, Hong Kong, South Korea, China and Taiwan.
USDA’s Global Agricultural Trade System data tracks U.S. exports and imports of agri-food products. These are broken down by BICO1
1 Bulk: wheat, coarse grains, rice, tobacco, rubber and allied products, unroasted coffee, cocoa beans, tea including herbs, raw beet and cane sugar, other bulk commodities
Intermediate: Tropical oils, other vegetable oils, feed and fodder, live animals, hides and skins, planting seeds, sugars, sweeteners, and beverage bases, essential oils, cocoa paste, cocoa butter, other intermediate products
Consumer Oriented: Snack foods, red meats (fresh/chilled/frozen/preserved), cheese, other dairy products, bananas and plantains, other fresh fruits, fresh vegetables, processed fruits and vegetables, fruit and vegetable juices, tree nuts, wine and beer, nursery products, roasted and instant coffee, spices, other consumer oriented products
categories (Bulk, Intermediate, and Consumer Oriented). USDA reports that the food and agricultural trade between these two countries is about US $120 million every single day. Total values of trade and the percentage breakdown for BICO categories in 2016 are given in the figure 1 below.
Figure 1: Canadian Agri-food Trade with U.S., 2016
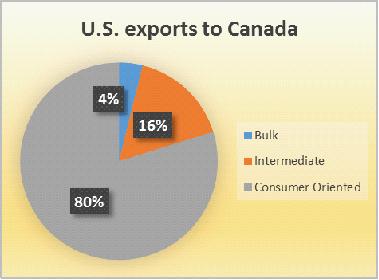 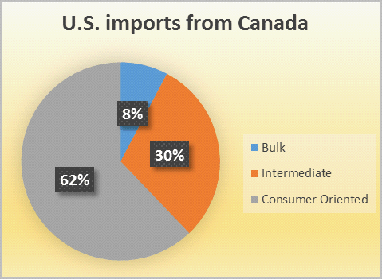
Source: USDA-FAS (Foreign Agriculture Service) Global Agricultural Trade System
These figures show that the largest market shares are for consumer oriented products. Therefore, this category is important for retail grocery and food service providers in both countries. According to the USDA, in 2016 Canada was the leading foreign export market for consumer oriented food (US $16.2 billion) for U.S. and the leading imported source of intermediate products for agri-food processing in the U.S. at about $US 6.5 billion. Trade values show that Canada had a trade surplus of about US $1.4 billion in 2016 in the agri-food sector.
Alberta’s Top Exports and Imports with U.S. by Product
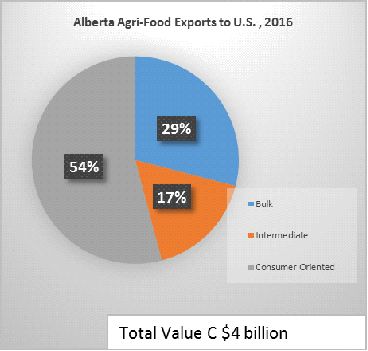
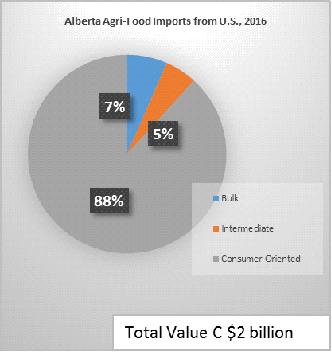
Alberta’s agri-food trade data with the U.S. shows a surplus A trade surplus (a surplus in the balance of trade) occurs when the value of a country's exports exceeds that of its imports. A trade deficit (also called a trade gap) occurs when imports exceed exports. of about C$2 billion in 2016. The figures 2 and 3 below indicate that both exports and imports have been increasing over the selected ten year period with a slight dip in imports in 2016. An analysis of top products (figures below) provides evidence that all top Alberta exports are bulk or intermediate products while all top imports are consumer oriented products.
Figure 2: Alberta Agri-Food Exports to U.S. by Products ($millions) – 2007 to 2016
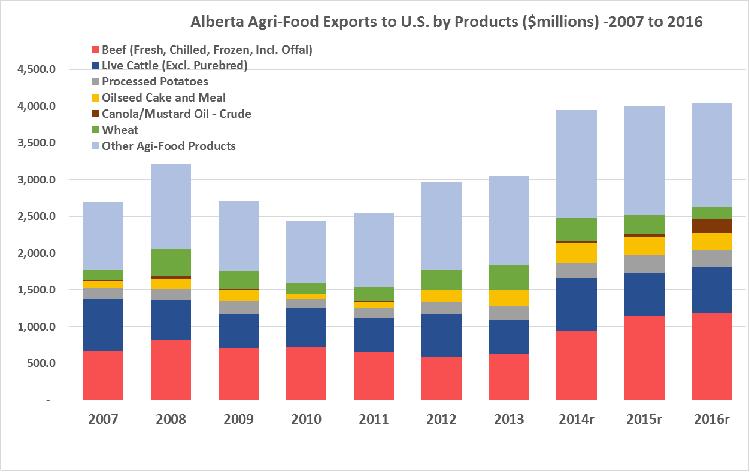
Source: Statistics Canada
Prepared by: Alberta Agriculture and Forestry, Economics and Competitiveness Branch,
Statistics and Data Development Section
Figure 3: Alberta Agri-Food Imports from U.S. by Product ($ Millions) – 2007 to 2016
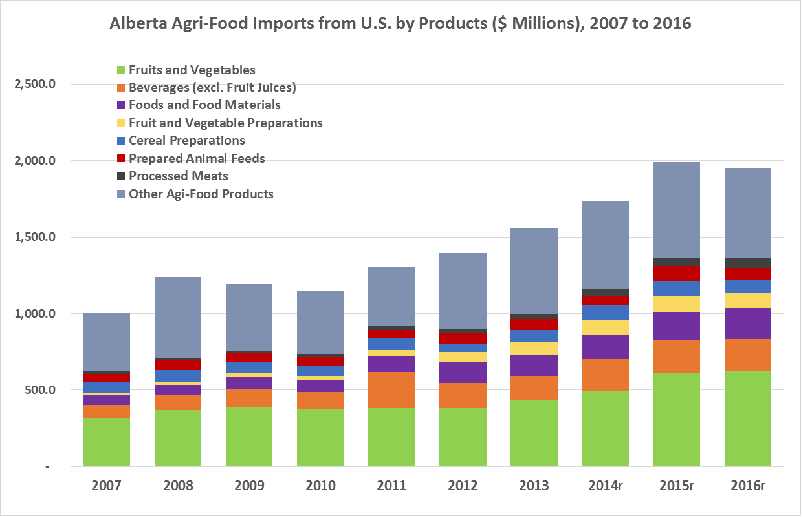
Source: Statistics Canada
Prepared by: Alberta Agriculture and Forestry, Economics and Competitiveness Branch,
Statistics and Data Development Section
An analysis of all Alberta imports and exports of agri-food products based on BICO categories (figure 4) illustrates that in 2016, 88 per cent of the Alberta imports were consumer oriented food and beverages valued at C $1.7 billion.
Figure 4: Alberta Agri-Food Trade with U.S., 2016
Source: Statistics Canada
Prepared by: Alberta Agriculture and Forestry, Economics and Competitiveness Branch,
Statistics and Data Development Section
To a significant degree, Canada plays the role of supplier of bulk and intermediate products to the U.S., and the resulting consumer oriented product are bought back from the U.S. by Canada. Compared to the average Canadian trade situation, in Alberta, the percentage of consumer oriented products in imports is higher. However, Alberta’s import value comprises only about nine per cent of the Canadian agri-food imports.
The renegotiation of NAFTA could have an impact on the consumer oriented products trade, which in turn could impact grocery retail and food services in Canada and Alberta.
Retail Landscape in Alberta and Canada
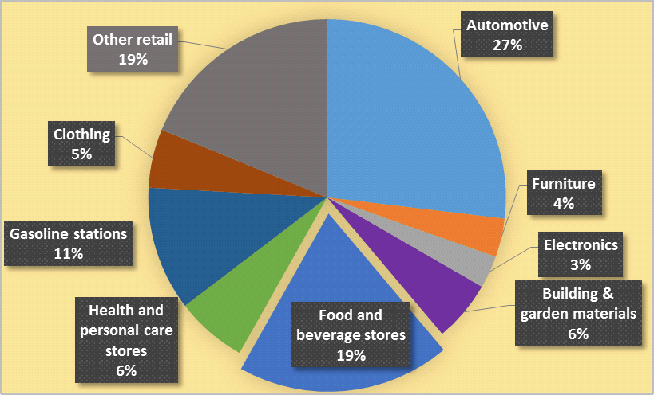
According to Statistics Canada, at the end of 2016, Canada’s total retail sales amounted to C$550.8 billion, an increase of 5.1 per cent from 2015. Food and beverage sales in 2016 contributed C$118.5 billion representing 21 per cent of the total retail sales. While in Alberta (Figure 5), the total retail sales were at C$75.1 billion. This was a decrease of 1.2 per cent from 2015. Alberta’s food and beverage sales were valued at about C$14.6 billion representing 19 per cent of the total retail sales.
Figure 5: Food and Beverage Sales in Alberta Retail Landscape in 2016
Source: Statistics Canada
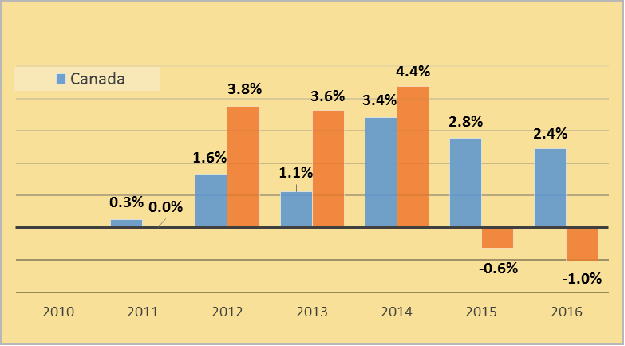
As illustrated in Figure 6 below, the six year growth trend for food sales in Canada and Alberta illustrate an interesting dynamic. The sales growth rate increased in Alberta until 2014, but then decreased significantly leading to negative growth in 2015 and 2016. These low growth rates can be attributed to the weaker economic condition in Alberta. Specifically, food sales may partly reflect high food prices and the significant strengthening of the U.S. dollar against the Canadian dollar.
Figure 6: Retail Food Sales Growth Rate in Alberta, 2010 to 2016
Source: Statistics Canada
In 2016, approximately 58 per cent of food sales were made through traditional grocery stores. This channel is primarily dominated by the “Big Three”- Loblaw’s, Sobeys and Metro. However, non-grocery retailers, particularly Costco and Walmart have gained market share in the last five years and now account for about 20 per cent of the share of retail grocery sales.
The discount retail channel has grown since the recession. Today, 36 per cent of all grocery items are sold either through this channel or through sales promotions, compared to 27 per cent in 2010. Each of the Big Three grocery retailers maintains a discount banner. For instance, Loblaw has No Frills and Sobeys has FreshCo. This trend is predicted to grow as other discount merchandisers such as Dollarama are offering more food staples to their customers.
Share of Market by Retail Channels in Canada
| Retailer | Estimated 2016 Food Sales (C$) |
| Loblaw Cos. Ltd./Shoppers Drug Mart * | 28,919,000,000 |
| Sobeys Inc. (Empire) /Safeway | 20,827,000,000 |
| Metro Inc. * | 11,124,000,000 |
| Costco Canada Inc.* | 19,162,000,000 |
| Walmart Canada Corp.* | 7,004,000,000 |
| Co-ops* | 3,574,000,000 |
| Overwaitea Food Group* | 2,759,000,000 |
| The Northwest Company* | 840,000,000 |
| Alimentation Couche-Tard* | 556,000,000 |
| Dollarama* | 525,000 |
 | |
| Longo Brothers Fruit Market * | $ 400,000,000 e. |
* Food sales only
Source: Who’s Who 2017, Canadian Grocer
Data Highlights
Food and Beverage retail sales, by industry, Alberta (Billion Dollars)
| Q1
2016 | Q2
2016 | Q3
2016 | Q4
2017 | Q1
2017 | Change from Q1_2016 to Q1_2017 |
| Total Food and Beverage Stores | 3.43 | 3.70 | 3.70 | 3.82 | 3.30 | -4% |
| Supermarkets and other grocery stores | 2.53 | 2.65 | 2.62 | 2.70 | 2.41 | -4% |
| Convenience stores | 0.18 | 0.20 | 0.22 | 0.20 | 0.18 | 1% |
| Specialty food stores | 0.12 | 0.14 | 0.13 | 0.17 | 0.15 | 22% |
| Beer, wine and liquor stores | 0.60 | 0.72 | 0.73 | 0.75 | 0.56 | -8% |
Source: Statistics Canada. Table 080-0020 - Retail trade, sales by the North American Industry Classification System (NAICS), monthly (dollars)
Alberta’s total food and beverage retail trade decreased by about four per cent in the first quarter of 2016 compared to the first quarter of 2017. The biggest drop occurred in beer, wine and liquor store sales. However, based on the total value of sales, supermarkets and other grocery store categories also reported a significant drop. It is interesting to see a significant percentage increase in sales for specialty food stores during the same period despite its relatively low percentage of total sales.
Sources
- Statistics Canada 2017. Retail trade, sales by the North American Industry Classification System (NAICS). CANSIM 080-0020
- USDA-FAS Global Agricultural Trade System
- Who’s Who 2017, Canadian Grocer, 2017
|
|