| |
Animal-Based Proteins
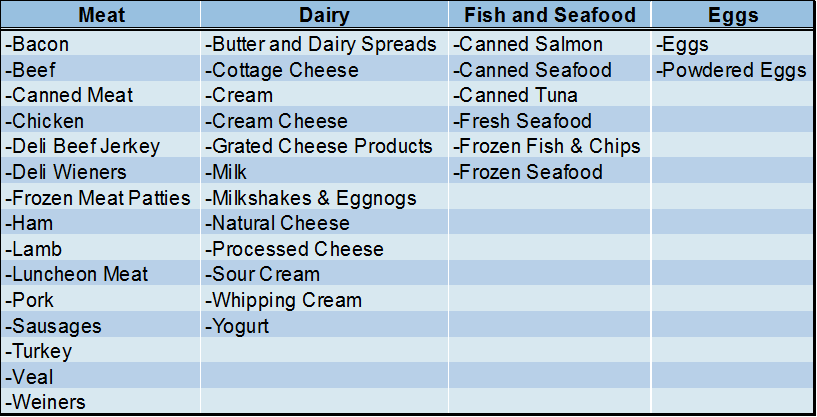
Animal-based proteins are considered the most traditional and common source of protein in developed nations. They boast having many essential amino acids important for the construction of complete proteins. Table 1 provides lists of common animal-based protein sources that are sold through retail channels in Canada.
Table 1. Sources of animal-based protein
Plant-Based Proteins
Plant-based proteins (PBP) are food items that are either raw or processed and consist of plant material as the source of protein. Many edible nuts and seeds contain high amounts of protein such as almonds, peanuts, hemp hearts, sunflower and chia seeds. Soybeans and their processed products such as tofu are also a popular source of PBPs among consumers. Pulses such as chickpeas, beans and peas also contain high amounts of protein, fibre, complex carbohydrates and have low amounts of sodium and fat. These PBP products can be eaten raw, cooked or processed into meat alternative/imitation foods. Also, many products such as almonds or lentils can be ground into flour and dairy-free products. Table 2 provides a list of common plant-based foods available to purchase through retail outlets.
Table 2. Sources of plant-based protein

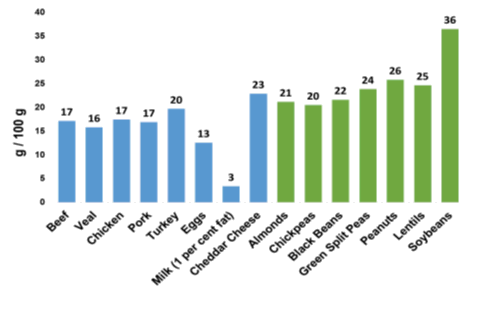
The amount of protein in food products varies greatly. Additionally, the method of cooking can affect the amount of protein in each product. Figure 1 displays the amount of protein in a variety of animal and plant-based protein products.
Figure 1. The amount of protein in 100 gram samples of various plant (raw at maturity) and animal-based (fresh ground meat) protein sources.
Source: USDA
Consumer and Retail Trends
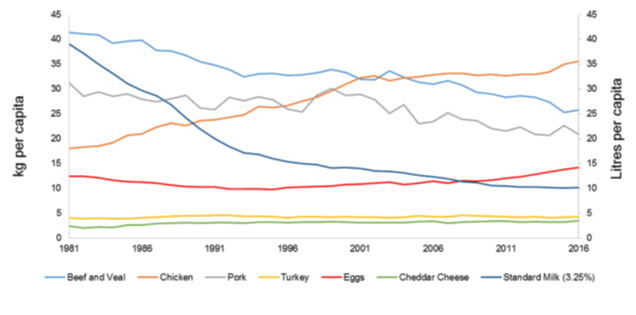
The level of consumption of animal protein products has varied in Canada over the past 30-plus years. Since 1981, the per capita decrease in consumption of beef/veal and pork was 37.7 percent and 32.9 percent, respectively. Turkey consumption has remained steady over the years , while chicken has increased by 97.4 percent. Egg and cheese consumption increased slightly while standard milk (3.25 percent) decreased by 73.9 percent. Figure 2 depicts these long terms trends.
Figure 2. Per capita consumption of animal protein products in Canada from 1981 to 2016.
Source: Statistics Canada
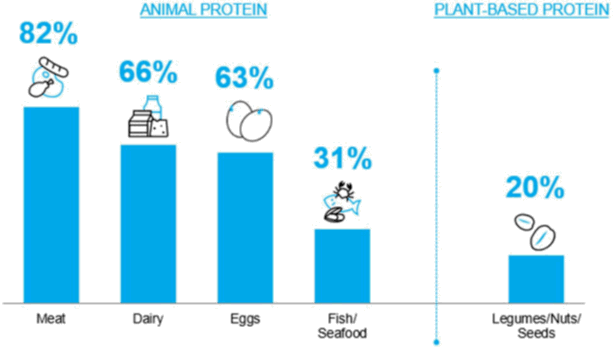
In light of this information, it is important to understand what consumers are purchasing as their primary sources of protein. Nielsen Panel views survey for 2017 offers insight into what Canadians consider to be their primary sources of protein. Figure 3 shows that the most common primary source of protein is meat fol-lowed by dairy, eggs, fish/seafood and lastly legumes/nuts/seeds
Figure 3. Percentage of Canadians that consider each food category to be their primary source of protein.
Source: Nielsen Panelviews survey 2017
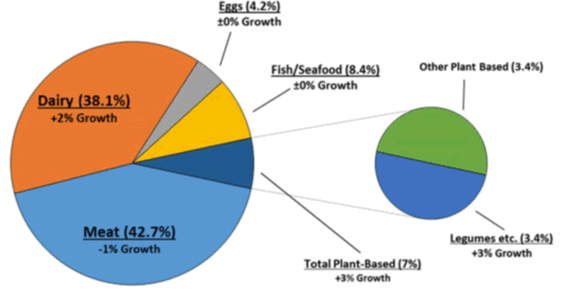
As depicted in Figure 3, animal-based products represent the majority of the protein market in terms of volume. However, plant-based items are leading in market growth. Figure 4 shows that plant-based foods are experiencing 3.0 per cent sales growth compared to -1.0 per cent in animal-based food during 2016. Furthermore, dairy leads growth in the animal-based proteins category at 2.0 per cent. Legumes/nuts/seeds are the highest growth category within the plant-based food items at 3.0 per cent.
Figure 4. Partitioning (dollar value) and growth (April 2016 to April 2017) of the protein-based market in Canada including sub-pie of plant-based protein market.
Source: Nielsen MarketTrack 2017
*Dairy growth may be partially driven by a recent increase in butter consumption
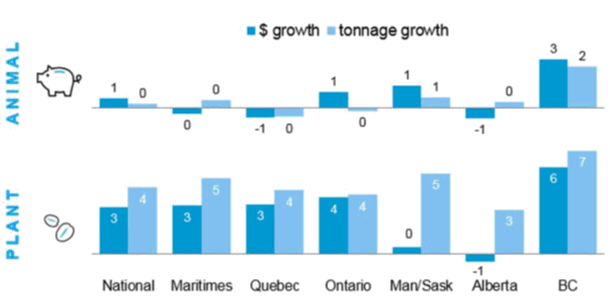
The volume and dollar value growth varies for animal and plant-based foods across the country. Figure 5 shows that the Maritimes and Manitoba/Saskatchewan drive volume growth, whereas Ontario and B.C. lead in dollar growth. It is also notable that although Alberta’s volume growth is at 3.0 percent, it is the only province showing a negative dollar growth of 1.0 per cent in plant-based proteins. This could be largely driven by the province’s weak economic conditions in 2016.
Figure 5. Dollar and volume growth of animal and plant-based protein products in various provinces of Canada from April 2016 to April 2017.
Source: Nielsen MarketTrack 2017
The growth in plant-based protein sales can be attributed to a variety of factors. One of these being the growing concern among consumers about animal welfare issues associated with the production of meat and dairy products. Impacts on human health that are attributed to meat consumption is another reason why some people are eating more alternative proteins.
There has been an increasing amount of research recommending lowering meat intake in human diets due to the risk of disease and other health implications. In fact, the Government of Canada’s first guiding principle in the latest revision process of the Canada Food Guide recommends “egular intake of vegetables, fruit, whole grains, and protein-rich foods* – especially plant-based sources of protein”.
Environmental and social sustainability issues are also having an impact on the rising demand for alternative proteins. As greenhouse gas emissions and climate change remain growing concerns, some consumers want to support production systems that are perceived to have less impact on the environment and the people around them.
Increasing ethnic diversity in Canada also could have contributed to this trend.
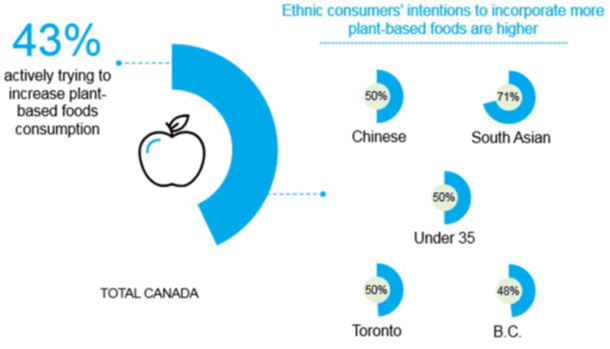
Figure 6 visually depicts the large portion of Canadians that are trying to increase their consumption of plant-based foods.
Figure 6. Percentage of various groups that are trying to increase their consumption of plant-based foods.
Source: Nielsen Panelviews Survey 2017
As some consumers’ preference moves from animal-based proteins to plant-based products, manufacturing companies are developing new products and practices to capture this economic opportunity. Evidence shows that the amount of people that prefer a diet free of animal products is increasing along with the demand for alternative proteins. According to The Plant Based Foods Association of the United States, the industry gen-erates US$6.1 billion in GDP contributions, 60,579 jobs and US$ 1.1 billion in taxes annually. They also state that the industry’s rate of growth from 2015 to 2016 was 3.4 per cent. Other market research groups suggest that the demand for meat substitutes will grow by 8.4 per cent over the next five years. This expected growth is coupled with predictions that the alternative protein market will occupy one third of the global protein mar-ket by 2054.
Changes in consumer preferences are already being noticed by large meat-based protein companies. Tyson Foods Inc., the largest animal protein company in North America, has started a venture capital fund that in-vests US$150 million in breakthrough technologies such as alternative proteins. More specifically, Tyson has bought a minority stake of 5.0 percent in plant protein burger company, Beyond Meat. Also, the Canadian-based animal protein giant Maple Leaf Foods is also following suit in pursuing plant-based products. They recently acquired Lightlife Foods, a leading plant-based protein manufacturer in the US holding 38 percent of the nation’s plant-based protein market share. The increased demand for alternative proteins is expected to further encourage businesses to adjust their product lines for the anticipated change in consumer preferences.
Data Highlights
Food Service and Drinking Places Sales in Alberta
|
2016 | 2017 |
|
Quarter 1
2016 | Quarter 2
2016 | Quarter 3
2016 | Quarter 4
2016 | Quarter 1
2017 | Quarter 2
2017 |
|
|
|
|
|
|
|
|
|
|
|
| Data in Canadian ($ Million) Source: Statistics Canada |
Food service sales were up in the second quarter of 2017, compared to the first quarter of 2017. Sales in the second quarter of 2017 were also up slightly as compared to the second quarter of 2016.
Sources:
Statistics Canada. 2017. Monthly survey of food services and drinking place, by North American Industry Classification System (NAICS). CANSIM 355-0006.
United States Department of Agriculture (USDA). 2017. USDA Food Composition Databases. Available at: https://
ndb.nal.usda. gov/ndb/sea rch/list
Statistics Canada. 2017. Per capita consumption of food products. CANSIM 002-0010.
Nielsen MarketTrack, National All Channels.
2017. 52 weeks ending April 29, 2017.
Private Use.
Nielsen Panelviews survey. 2017. Private Use. |
|