| |
 |
Alberta farm income, 2008 | Tables and figures
Measures of Net Farm Income (1) - Definitions
The agriculture economic statistics program uses three aggregate measures of net farm income:
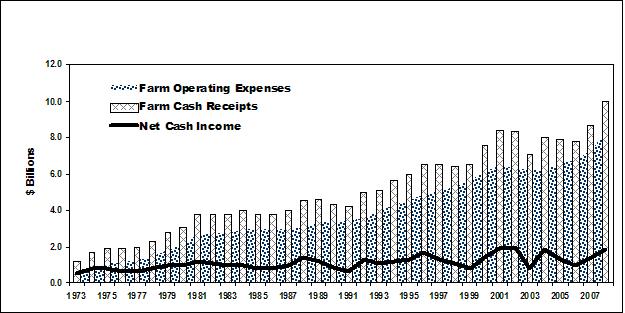
Net cash income measures farm business cash flow (gross revenue minus operating expenses) generated from the production of agricultural goods. Net cash income represents the amount of money available for debt repayment, investment or withdrawal by the owner.
Realized net income (RNI) measures the financial flows, both monetary (cash income) and non-monetary (depreciation and income-in-kind), of farm businesses. Similar to net cash income, realized net income represents the net farm income from transactions in a given year, regardless of the year the agricultural goods were produced.
Total net income measures the financial flows and stock changes of farm businesses. Total net income values agriculture economic production during the year that the agricultural goods were produced. It represents the return to owner's equity, unpaid labour, management and risk.
Components of Net Farm Income Measures
Farm cash receipts include revenues from the sale of agricultural commodities, program payments from government agencies, and payments from private crop and livestock insurance programs. Receipts are recorded in the calendar year (January-December) when the money is paid (cash basis) to farmers. Farm to farm sales are excluded. They are assumed to cancel each other out, and have no net impact.
Farm operating expenses represent business costs incurred by farm businesses for goods and services used in the production of agricultural commodities. Expenses, which are recorded when the money is disbursed by the farmer, include property taxes, custom work, livestock purchases, rent, fertilizer and lime, pesticides, machinery and building repairs, fuel for heating and machines, wages, interest and business share of insurance premiums.
Income-in-kind measures the value of the agricultural goods produced on farms and consumed by farm operator families. It is included to measure total farm production. There is no monetary disbursement related to income-in-kind. It is calculated using Statistics Canada estimates of per capita food consumption, coupled with Census (2) measurements of the farm population and the average prices that producers would have received in the marketplace.
Depreciation charges account for the economic depreciation or for the loss in fair market value of the capital assets of the farm business. There is no monetary disbursement associated with depreciation. Calculated on farm buildings, farm machinery, and the farm business share of autos, trucks and the farm home, depreciation is generally considered to be the result of aging, wear and tear, and obsolescence. It represents a decrease in the potential economic benefits that can be generated by the capital asset.
Value of inventory change (VIC) measures the dollar value of the physical change in producer-owned inventories. This concept is used to value total agricultural economic production. To calculate VIC, the change in producer-owned inventories (between the end and the beginning of a calendar year) is first derived and then multiplied by the average annual crop prices or value per animal. This calculation is different from the financial or accounting book value approach, which values the beginning and ending stocks, and then derives the change.
(1) Source: Adapted from Agriculture and Agri-Food Canada and Statistics Canada, Understanding Measurements of Farm Income, Publication No. 2060/B and Cat. No. 21-525-XIE, November 2000, Section 1 "Agriculture Economic Statistics Program Measures".
(2) Statistics Canada, Census of Population
Alberta Farm Income in 2008
Farm Cash Receipts
Alberta's total farm cash receipts (FCR) increased substantially in 2008, to a new industry high of $10.0 billion. FCR is the sum of crop and livestock market receipts plus program payments to producers. The record receipts were 15.5 per cent higher than in 2007, and 26.9 per cent above the five-year average (2003-2007). Fuelling the growth were record crop market receipts and higher program payments, which more than offset a marginal decline in livestock market receipts. Alberta’s total farm market receipts (FCR excluding program payments) increased 14.3 per cent from 2007, to a new all-time high of $8.9 billion.
Crop market receipts jumped 33.1 per cent from 2007, to a record $4.6 billion. The increase was driven mainly by stronger prices for most major crops. Showing significant gains in receipts to new record highs were canola and wheat (including durum). Canola receipts rose by 53.4 per cent from a year earlier, to $1.9 billion, while wheat receipts (including durum) gained 41.3 per cent from 2007, to $1.8 billion. Also, setting a new record high in 2008 were receipts for dry peas, which were up 8.1 per cent from last year, to $122.1 million. Increasing as well, were receipts for barley, up 3.7 per cent, to $331.0 million, and potatoes, which rose to $154.8 million, or up 11.2 per cent from 2007.
Livestock market receipts fell marginally, by 0.9 per cent, from 2007, to $4.2 billion in 2008. The decline in livestock receipts was attributed mainly to a drop in receipts for cattle and calves and hogs, as a result of generally lower marketings and prices. Cattle and calf receipts decreased by 1.9 per cent, to $3.0 billion, but remained 4.9 per cent above the five-year average (2003-2007). Hog receipts fell for the fourth consecutive year, to $397.4 million, down 7.9 per cent. In the supply-managed sector, dairy and poultry receipts climbed to new industry highs in 2008, fuelled by stronger prices and marketings. Dairy receipts climbed 7.6 per cent, to a record $459.3 million. Poultry receipts (hens, chickens and turkeys), rose 16.3 per cent, to $209.8 million. Also showing gains were egg receipts, which increased by 14.7 per cent, to $50.3 million.
Direct Program Payments
Direct program payments to Alberta producers increased in 2008, rising 25.5 per cent from 2007, to $1.1 billion. The increase in payments was supported by higher payments under the Canadian Agricultural Income Stabilization Program (CAIS), which includes programs such as the CAIS Inventory Transition Initiative and the Alberta Farm Recovery Plan and Growing Forward programs (including AgriStability), rose by 39.3 per cent, to $695.9 million, and by Crop and Hail Insurance, increasing by 30.8 per cent, to $344.6 million. Crop and Hail Insurance payments increased by 30.8 per cent to $344.6 million, due to higher claims. The Net Income Stabilization Account (NISA) withdrawals fell 13.8 per cent, to $48.9 million.
Farm Operating Expenses and Net Farm Income
In 2008, Alberta producers spent an estimated $8.3 billion in farm operating expenses (net of rebates), setting a new record high and, up 12.8 per cent from 2007. In particular, fertilizer and lime expenses jumped 48.0 per cent to $1.2 billion, due to a sharp increase in price. Other notable increases included expenses on commercial feed which rose 13.6 per cent to $1.3 billion, and machinery fuel and repairs, up 14.6 per cent, to $1.2 billion. However, there was a decline in livestock and poultry purchases which fell by 4.2 per cent, to $656.4 million.
Alberta’s farm income situation showed a marked improvement in 2008, compared to 2007. As a result of the record FCR more than offsetting the record expenses, the province’s net cash income (or FCR less farm operating expenses) increased 29.8 per cent from 2007, to $1.8 billion, the fourth highest on record. After adjusting net cash income for depreciation (a non-cash cost of $1.3 billion), the resulting realized net income (RNI) was substantially improved at $451.6 million, up from $108.5 million in 2007. Also, total net income (which adjusts RNI for value of inventory change) jumped to $1.2 billion, from negative $194.4 million a year earlier.
Farm Debt and Capital Values
Alberta’s total farm debt outstanding on December 31, 2008 was $12.7 billion, up 7.4 per cent from a year earlier. Chartered banks were owed $5.5 billion (43.4 per cent of the total farm debt), rising 6.3 per cent from 2007. The next largest group of lenders consisted of federal government agencies such as Farm Credit Corporation and Business Development Bank of Canada. This group was owed $2.9 billion (22.6 per cent of total farm debt), increasing 16.5 per cent from 2007. Provincial government agencies such as Agriculture Financial Services Corporation followed with a total of $2.4 billion in loans to Alberta producers (18.9 per cent of total farm debt), up 2.4 per cent from a year ago. Credit Unions were also a source of credit, accounting for $729.4 million in loans to farmers (5.8 per cent of total farm debt), up 0.7 per cent from 2007. Other lenders, including insurance and trust companies, were owed a total of $964.0 million, down 1.1 per cent from a year ago (7.6 per cent of total farm debt).
The total value of farm capital (land and buildings, machinery and equipment, and livestock and poultry), at July 1, reached a new record high in 2008, of $87.3 billion. Since 1993, farm capital value has steadily increased, and was up 10.7 per cent from 2007. The increase was attributed to all-time highs in the value of land and buildings, along with machinery and equipment, which more than offset a decline in the value of livestock and poultry. The value of land and buildings increased 14.2 per cent, to $72.8 billion, while the value of machinery and equipment rose 2.9 per cent, to $10.1 billion. The value of livestock and poultry fell to $4.4 billion, down 16.7 per cent from 2007.
Source: Statistics Canada; and Alberta Agriculture and Rural Development, Statistics and Data Development Branch
Tables and Figures
| Alberta Farm Income, 2008 | |
Tables | PDF File
Size |
| Table 1 - Selected Farm Income Statistics ($'000), Canada and Provinces, 2004-2008 | |
| Table 2 - Farm Cash Receipts by Type, Alberta and Canada, 2007 and 2008 | |
| Table 3 - Alberta Farm Cash Receipts by Type, 1979-2008 | |
| Table 4 - Alberta Farm Cash Receipts From the Sale of Crops, 1979-2008 | |
| Table 5 - Alberta Farm Cash Receipts From the Sale of Livestock, 1979-2008 | |
| Table 6 - Alberta Farm Operating Expenses and Depreciation, 1979-2008 | |
| Table 7 - Alberta Net Farm Income, 1979-2008 | |
| Table 8 - Value of Alberta Farm Capital and Value Per Acre of Farm Land and Buildings, at July 1, 1979-2008 | |
| Table 9 - Alberta Farm Debt Outstanding by Lender at December 31, 1979-2008 | |
Figures | PDF File
Size |
| Figure 1 - Distribution of 2008 Canadian Farm Cash Receipts ($ Billions) | |
| Figure 2 - Alberta Farm Income Indicators, 2004-2008 | |
Figure 3 - Alberta Farm Cash Receipts, Crop Market Receips and Livestock Market Receipts, 2004-2008
Figure 4 - Distribution of Canadian Farm Cash Receipts ($ Billions), 2008
Figure 5 - Per Cent Change in Farm Market Receipts (Crops and Livestock), Canada and Selected Provinces, 2008/2007 | |
|
|
|
|
|
|
|
|
|
|
|
|
|
|
|
|