| | Precipitation | Temperature | Heat units | Frost-free period | Growing season length | Wind
This document is part of the Agroclimatic Atlas of Alberta.
The climate elements that most frequently influence agriculture are precipitation and temperature. These provide the energy for plant growth and the water required for the plant to take full advantage of the energy available. Animals are affected more by extremes of temperature and precipitation than by average conditions.
Precipitation
Precipitation provides the source of all terrestrial water. It occurs in many forms, including rain, snow, dew and hail, but rain and snow are the greatest contributors.
In Alberta, precipitation is not uniformly distributed throughout the year. Generally, in agricultural areas, 50 to 60 per cent of annual precipitation occurs during the growing season, mostly as rain. The four summer months of May, June, July and August provide about double the precipitation amount compared to the other eight months of the year.
Figure 6 shows the long-term average distribution of precipitation for Medicine Hat, Edmonton and Grande Prairie for each month. Precipitation in southern Alberta and the Peace Region peaks in June, while in central Alberta the peak occurs in July.
Figure 7 shows precipitation from September 1 to August 31, from 1961 to 2000, for Lethbridge, Edmonton and Grande Prairie. The information is split into overwinter precipitation (September 1 to April 30) and growing season precipitation (May 1 to August 31).
Precipitation in any month is extremely variable with dry spells of a month or more possible at any time. In general, the variability of precipitation is greater in southern Alberta than in the Peace River Region and central Alberta.
Crop water use generally exceeds precipitation during the growing season in Alberta. Therefore, overwinter precipitation is significant for building up soil moisture reserves for crop production. In the interval between harvest and seeding of annual crops, 25 to 30 per cent of the precipitation is rain, while the rest is snow. (See Soil Moisture Conditions in Alberta for more information on soil moisture reserves.)
Temperature
Temperature affects all living things. Each plant and animal has its own specific optimum temperature for growth and a temperature range over which it thrives. Once temperatures outside this range are encountered, the animal or plant suffers and growth slows. Cool season crops such as wheat, barley and oats do not grow well at temperatures below 5�C. They grow best between 15 and 25�C, and their optimum temperature for growth is about 20 to 22�C, depending on the species. Cool season crops are stressed by temperatures above 30�C. Warm season crops such as corn require temperatures about 5 to 10�C warmer than cool season crops.
In the winter, the average temperature decreases towards the north and with distance from the mountains and the decreasing effect of the chinook. In the summer, the highest elevations have the lowest temperatures, and the influence of latitude is less. The highest temperatures occur where the elevation and precipitation are the least. High areas have lower temperatures than the surrounding lowland area because temperatures drop 1�C for each 100-m rise in elevation.
Heat Units
The heat available for agricultural purposes can be expressed in various types of heat units. These include growing degree days, corn heat units, P-days and heating degree days.
Growing degree days
A degree day is the departure of the average temperature for a day from some reference temperature. Growing degree days are used to match crop requirements for heat to the amount of heat available. The reference temperature for calculating growing degree days is the minimum threshold temperature at which plant growth starts. For most of the major crops grown in Alberta, the minimum threshold temperatures range from 0 to 5�C (Table 1). For crops like beans and corn, the threshold is 10�C. The upper temperature threshold for most crops grown in Alberta is 30�C; temperatures higher than this upper threshold can damage plants.
Table 1. Minimum threshold temperatures for growth of selected crops and insects
| Crop or insect | Minimum threshold temperature (�C) |
| Wheat | 0.0 |
| Barley | 0.0 |
| Spinach | 2.2 |
| Lettuce | 4.4 |
| General plant growth | 5.0 |
| Canola | 5.0 |
| Forages | 5.0 |
| Cabbage maggot | 6.0 |
| Potatoes | 7.0 |
| Variegated cutworm | 7.0 |
| Corn and beans | 10.0 |
| Grasshoppers, corn borers | 10.0 |
| General insect development | 15.0 |
Adapted from: Ash et al., 1999. Agricultural Climate of Manitoba; and Cao and Moss, 1989. Temperature Effect on Leaf Emergence and Phyllochron in Wheat and Barley.
To calculate the growing degree days for any particular day, the average daily temperature is determined from the maximum and minimum air temperatures. The minimum threshold temperature, 5�C in the following example, is subtracted from the average daily temperature:
| Maximum temperature = | 27�C |
| Minimum temperature = | 15�C |
| Average temperature = (27+15) � 2 = | 21�C |
| Degree days above 5�C = 21 - 5 = | 16 |
If the average daily temperature is below the base temperature, the growing degree day value equals zero. Negative values are not calculated because the crop is not set back. The calculation of growing degree days assumes that plant growth is related directly to temperature if there are no other limitations. This is generally true as long as temperatures are not high enough to cause damage to plants. When applying degree days, it is important to know the temperature units (Fahrenheit or Celsius) and the minimum threshold temperature used for the calculation.
Annual degree days are calculated by summing the degree days for each day of each month in the growing season. Degree day climate normals are calculated by averaging the yearly values for the 30-year period. The average annual growing degree days for Alberta are shown on the maps of Annual Total Degree Days Above 5�C.
Degree day climate normals permit comparison of areas in terms of their growing potential. For example, two types of canola have quite different degree day requirements. Argentine varieties require 1040 to 1100 degree days, while Polish varieties only require 860 to 920. Looking at the number of degree days available for growth will help in selecting the canola type most suited to an area. For delayed seeding or reseeding, calculating the degree days expected in the remainder of the growing period will help determine which type to plant.
Corn heat units
A more complex calculation is used to determine corn heat units (CHU), a measure of how heat affects the growth of corn.
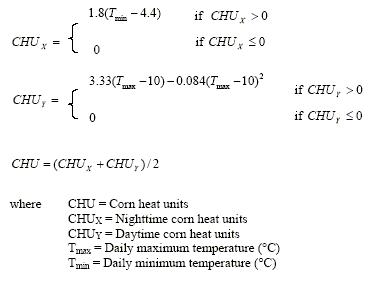
Like growing degree days, the daily CHU is calculated from the daily maximum and minimum air temperatures. However, the CHU calculation takes into account that the crop responds differently to daytime and nighttime temperatures. It assumes no growth occurs during the night when temperatures are below 4.4�C and during the day when temperatures are below 10�C. Also the calculation uses 30�C as the optimum daytime temperature because warm season crops develop fastest at 30�C. There is no optimal temperature for night since the nighttime temperature seldom exceeds 25�C. The daily CHU is the average of the daytime and nighttime CHU values. The formulas are as follows:
The accumulated CHU is the sum of the daily CHU from a starting date to a season-ending date. The date to start accumulating CHU is estimated as the last day of three consecutive days with mean daily air temperatures greater than or equal to 12.8�C. The threshold temperature of 12.8�C corresponds closely with the average seeding date for grain corn. It also corresponds to the time when sufficient heat has been received to raise the soil temperature to 10�C, which ensures corn germination. The ending date for accumulating CHU is the first fall frost with a minimum temperature equal to or less than -2�C.
The annual total corn heat units for Alberta are shown on map of Annual Total Corn Heat Units.
P-days
Physiological days for potatoes, called P-days, are a measure of how heat affects the growth and development of potatoes. Like CHUs and degree days, P-days are calculated using the daily minimum and maximum air temperatures. The calculation of the daily P-day value divides the day into four parts to account for temperature variations. For potatoes, the minimum, optimum, and maximum developmental temperatures are 7�C, 21�C and 30�C, respectively. P-day maps were not calculated for this Atlas.
Heating degree days
Another use of the degree day concept is heating degree days, which indicate the amount of heating required for buildings. Heating degree days, shown on map Annual Total Degree Days Below 18�C, are calculated by subtracting the daily average temperature from the base temperature of 18�C. From these values, the energy needed to maintain a comfortable temperature in a building can be estimated. Heating degree days or some other similar unit with a different base temperature could be used to estimate livestock feed requirements.
Frost-free Period
The frost-free period is the number of days between the last date of 0�C in the spring and the first date of 0�C in the fall. It provides a measure of the period during which plant growth should occur uninterrupted by frost, and it provides a way to compare growing conditions within the province.
The frost date is the date when the air temperature drops to 0�C. Air temperature is measured at 1.2 m above the ground surface at weather stations by thermometers inside a Stevenson screen (see Understanding Weather and Climate Data). However, the air temperature close to the ground surface, where the crop occurs, is cooler than the temperature at screen height.
A few stations, including five of Agriculture and Agri-Food Canada's weather stations, also record temperatures at 3 or 4 cm above a short-grass surface using thermometers exposed to sunlight. These grass temperatures are more representative of the crop temperature. When frost occurs in late spring and early fall, research shows that the grass minimum temperature is always lower than the temperature at the screen height. The difference varies, but is generally from 2 to 5�C.
Although the screen temperature is used to estimate frost dates, the difference between the air temperature at screen level and at crop level does not generally create large discrepancies in determining the frost-free period for most crops. Grain crops generally freeze at several degrees below 0�C, so a screen temperature of 0�C is a suitable indicator of damaging frost for these crops.
Actual frost damage depends on the temperature, crop type and crop condition. Most of the field crops grown in Alberta can withstand temperatures as low as -2�C without significant damage. Many seedlings can withstand temperatures of -4 to -6�C without harm. This permits spring seeding to start when soil temperatures reach a suitable level, rather than waiting until the last chance of frost passes. The crop stage most susceptible to frost damage is flowering.
The frost date varies from year to year. Within any given area, local conditions may cause a variation in the frost dates by as much as several weeks. The data presented in Figure 8 show that about 50 per cent of the last spring frosts occur in a period of a week before and after the average last frost date. In the fall, the first frost occurs 50 per cent of the time in a period of one week before and about one and a half weeks after the average first frost date. The average frost dates in Alberta are shown on the maps, Date of Last Spring Frost (<0�C) and Date of First Fall Frost (0�C).
The effect of a 100-day frost-free period is not equal across the province because day length varies. The longer day length in the Peace River Region, compared to southern Alberta, partly compensates for the effects of the shorter frost-free period in the north. Each crop reacts differently to increasing day length, so no general adjustment of frost-free periods for day length is possible.
Estimating probable frost dates
Average dates of frost occurrence have often been used for estimating probable freezing dates. However, averages have limited value because they denote the 50 per cent risk level or the probable occurrence of untimely frost in, for example, five out of 10 years. This may well be too much risk for economic viability in the long run.
On the other hand, trying to avoid all frost damage by sticking to a limited number of hardy, short-season crops may not be profitable either. The indirect costs of lost opportunities could be very high. For planning purposes, it may be better to use an intermediate risk level, such as 25 per cent, where the advantages of growing a particular crop outweigh the risks of occasional frost damage
Probable frost dates can be estimated using the following method:
| 1. | Find the average dates (50 per cent risk level) for the last spring frost and the first fall frost for a location from Table 2 or Table A1 in the Appendix. (Table A1 lists the stations in the agricultural area of Alberta; Table 2 below lists a few selected stations.) |
2. |
Next, use the appropriate curve, either Spring or Fall, on the Figure 8 to estimate the freezing date adjustment factor for the desired risk level.
The Spring curve indicates the probability of the last spring frost occurring after a certain date. The Fall curve indicates the probability of the first fall frost occurring before a certain date. The two curves are derived from long-term minimum temperature records at stations representing the major agricultural regions in Alberta. Estimates from the curves are generally accurate within one or two days for the 15 per cent to 85 per cent probability range. |
3. |
Add the freezing date adjustment factor to the average date for the probable frost date at that risk level. |
As an example, spring and fall frost dates at Tofield (50 km southeast of Edmonton) can be estimated for the 25 per cent risk level using this method. The weather station closest to Tofield is Tofield North. From Table 2, the average date for the last spring frost at Tofield North is May 25. Using the Spring curve on the figure and the 25 per cent risk level, the adjustment factor is +9 days. Nine days after May 25 is June 3. Similarly, the average date for the first fall frost at Tofield North is September 14, and the freezing date adjustment factor from the Fall curve is -9 days. Nine days before September 14 is September 5.
Table 2. Frost dates for selected Alberta locations
| Station location | Average date of first fall frost | Average date of last spring frost | Frost-free period |
| Calgary Int'l A | September 14 | May 20 | 117 |
| Edmonton Int'l A | September 13 | May 21 | 115 |
| Grande Prairie A | September 11 | May 18 | 116 |
| Lethbridge A | September 18 | May 17 | 124 |
| Lloydminster A | September 15 | May 19 | 119 |
| Medicine Hat | September 23 | May 14 | 132 |
| Red Deer A | September 12 | May 20 | 115 |
| Tofield North | September 14 | May 25 | 112 |
Growing Season Length
The growing season is the period of time each year during which perennial crops such as pastures and forages can grow. The growing season is longer than the frost-free period. Plant growth begins whenever air and soil temperatures are above freezing most of the time. When the average daily air temperatures reach 5�C for a 5-day period, daily heat unit accumulations begin.
The start, end and length of the growing season are different every year. The variability in the growing season is similar to that for the frost-free period. Start of Growing Season (>=5�C) Map shows the average starting date, End of Growing Season (<5�C) Map shows the average ending date, and Length of Growing Season (>5�C) Map shows the average length of growing season.
The average length of the growing season can be used to compare growing conditions across the province. Figure 9 shows the average growing season lengths for three stations. Small areas of longer growing season lengths exist in various parts of the province because of local conditions.
As with frost-free period and degree day calculations, the length of the growing season does not account for the effect of longer summer day length in northern Alberta compared to southern Alberta. The longer day length helps compensate for the shorter growing season and lower heat units, making crop production better than might be expected in northern Alberta.
Wind
Wind is an important consideration for agricultural producers. Wind gusts and prevailing wind direction are factors in preventing soil erosion, making effective agricultural chemical applications, managing manure and designing structures. Higher wind gusts and drier conditions also increase the risk of fires getting out of control.
Wind erosion occurs when soil is not adequately covered and when winds are strong enough to move soil particles. Wind erosion reduces soil productivity. Winds can carry soil particles and soil-attached chemicals and nutrients into the air, reducing air quality and visibility. Eroded particles can be deposited in water bodies, reducing water quality.
Mean Wind Speed and Prevailing Direction (December, January and February): 1971 to 2000, Mean Wind Speed and Prevailing Direction (March, April and May): 1971 to 2000, Mean Wind Speed and Prevailing Direction (June, July and August): 1971 to 2000 and Mean Wind Speed and Prevailing Direction (September, October and November): 1971 to 2000 show mean wind speeds and wind direction. Lands subject to windy weather require practices to prevent wind erosion, such as reducing or eliminating tillage, and planting field shelterbelts. Areas with frequent high winds may need to be kept under perennial cover. Prevailing wind direction and speed are important factors in designing field and farmstead shelterbelts. For example, where possible, shelterbelts should be planted at right angles to the most common prevailing wind direction.
Wind speed and direction are also important considerations when applying pesticides and fertilizers. For instance, farmers applying agricultural chemicals must check product labels for wind speed limits and should avoid spraying when the wind is blowing toward sensitive areas such as water bodies.
Winds can blow unpleasant odours towards neighbouring residences. Where possible, facilities that generate strong odours should be located downwind of nearby residences, and manure should be spread when the wind is blowing away from residences.
Maximum wind speeds are a factor in the design of buildings and other structures that must withstand high winds. Table 3 lists the average number of days with wind gusts greater than 52 km per hour and 63 km per hour for Lethbridge, Edmonton and Grande Prairie Airports for each month. It also shows the greatest wind gust ever recorded for each month at the three weather stations, including the wind direction and date of the event.
Table 3. Wind gust speed and direction for three Alberta stations
a. Wind gusts for Lethbridge Airport
b. Wind gusts for Edmonton International Airport
c. Wind gusts for Grande Prairie Airport
* These stations started to collect hourly wind speed and direction data in 1953.
Source: Environment Canada, 2003. Canadian Climate Normals for 1971 to 2000. |
|