| | Active C field method | Basic EDTA field method | Discussion
Active C Field Method
An example of a characteristic standard curve based on the standard readings is shown in Figure 3. This standard curve is used to relate the absorbance readings to the amount of active carbon in each of the samples.
 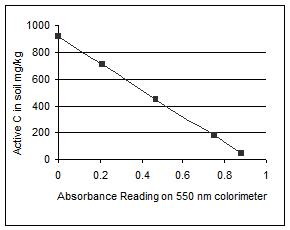
Figure 3. Characteristic standard curve generated using the 550 nm colorimeter (left). A sample of the use of the standard curve to relate absorbance readings to active C in the soil sample (right).
Descriptive statistics were calculated for each of the 41 benchmark sites active C values (Appendix 6). Active C values ranged from 194 to 964 mg carbon per kg soil. Of the 41 sites included in this study 17 had high variances of 1000 or more. Fourteen of these sites were located within the mixed grassland and Peace Lowland/Boreal transition ecoregion and the remaining three occurred in the Athabasca Plain ecoregion.
We compared the estimated active C obtained by the field method of Weil et al. (2003) to the light fraction carbon (LFC) determined by the University of Alberta (Figure 4).
Although there was a positive correlation between the amount of LFC and active C in the samples, the two factors were not closely related (R2=0.18).
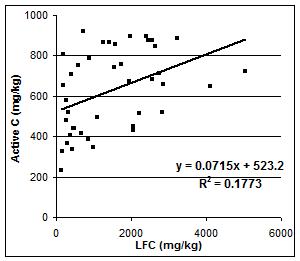
Figure 4. Relationship between active C (mg/kg) and LFC (mg/kg).
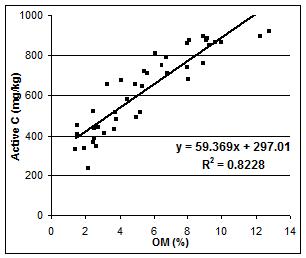
Figure 5. Relationship between active C (mg/kg) and organic matter (%).
We then compared the OM% values obtained from Norwest Labs to the estimated active C measured (Figure 5). The linear association between the percent of organic matter and active C was positive and had a high correlation (R2=0.82). It appears that there may be a ceiling effect occurring for soils having higher values of organic matter determined by the lab since none exceed 964 mg/kg active carbon. However, further investigation is necessary to verify the relationship between active carbon and organic matter and between active carbon and light fraction carbon.
We expected to see a stronger relationship between the active C and the amount of light fraction carbon as both measure the active or labile fractions of soil organic matter. However, the strong correlation between the active C and the percent organic matter suggests that this method could be used in the field to successfully determine the amount of soil organic matter.
Basic EDTA Field Method
The descriptive statistics were calculated for the estimated organic matter for each of the 41 benchmark sites (Appendix 7). The values ranged from a low of 1.5% organic matter to a high of 12% organic matter. The variance between reps reached a high of 3%, and occurred in samples in which it was necessary to differentiate between 6% and 9% organic matter. We found it easy to distinguish up to the 6% standard, but after this it was more difficult.
The correlation of estimated organic matter (%), by the method of Bowman (1997), and the lab percent organic matter (Figure 6) was positive and indicated that the two values were related (R2=0.67).
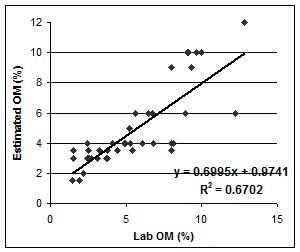
Figure 6. Correlation of lab OM (%) values and estimated OM (%).
To determine the ability of the test to distinguish between higher and lower values of organic matter we separated the data into two groups based on lab values over or under 6% organic matter. We found that the correlation was higher (R2=0.52) when differentiating between 0% and 6% organic matter (Figure 7) and then decreased (R2=0.37) when attempting to differentiate between the higher levels of organic matter (Figure 8).
This corresponded to our observations while carrying out the procedure. The standards created for the purposes of comparison were easy to distinguish at 0, ~1.5, 2, 3, 4 and 6%. However, when the standards were created for the range of 6 to 12% it was harder to visually discern the filtrates from each other (Figure 9).
 | 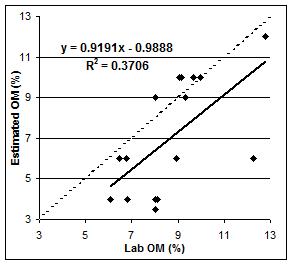 |
| Figure 7. Correlation of known lab OM (%) values under 6% and estimated OM (%). | Figure 8. Correlation of known lab OM (%) values over 6% and estimated OM (%). |
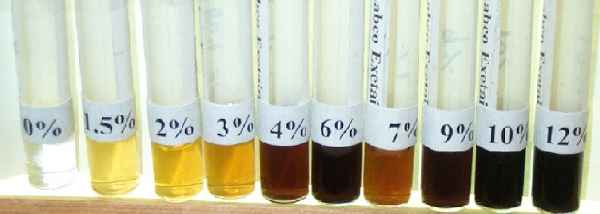
Figure 9. Organic matter standards for Basic EDTA method.
The standards for 6 and 9% were impossible to distinguish from each other and this was the same for the standards of 10 and 12%. There was a marked visual difference between the 9% standard and the 10% standards. In creating the 7% standard we found that the filtrate was lighter than the 6 and 4% standard, and darker than the 3%. To deal with this anomaly we recorded any filtrate that visually matched this color as 3.5% organic matter to correspond with the gradient of filtrate occurring between 0 and 6%.
Discussion
The objectives outlined by Weil et al. (2003) included developing a method that was simple, quick, reproducible, and safe. In Bowman (1997) these same objectives are reiterated, along with meeting the goals of cost effectiveness and accuracy. After testing the two methodologies on soils found throughout Alberta we now must determine if either has met any or all of the proposed goals.
Active C field method
The methodology described by Weil et al. (2003) was easy to follow. Creating the standard solutions involved calculations to determine the quantity of chemical needed to ensure the correct molarity. To make up the standard curves and determine the amount of active carbon in the samples required the use of a method of least squares means (Mendenhall 1983). Both these aspects required referring to information sources outside of the directions provided by the authors, which may not be readily available to others. In order to make this process as simple as possible for the potential user it would be preferred to provide the molarity calculation information within the procedure or provide the solutions already prepared. Weil et al. (2003) found that the standard solutions maintained consistent concentrations when retested after three years. Similarly, we found no statistically significant difference between the readings of the standard solution after a two-month period to readings obtained at the beginning of the study. Therefore, using a generalized standard curve that relates the absorbance readings to the amount of active C would clarify this process even further. This would eliminate both the need to keep standard solutions in the kit and concerns regarding maintaining standard solutions and supplying them to users.
Due to the large quantity of samples in our study the process took longer then would be expected for someone employing this technique in the field with minimal samples to process. Weil et al. (2003) required that their samples be dried for 15 minutes and then analyzed. However, when comparing all samples it is preferred that the samples are of equal dryness in order to achieve minimum variability (Weil et al. 2003). If this method were to be included in the Soil Quality Test Kit for use in Alberta it is recommended that the samples be air dried for 24 hours or more to achieve minimum variability. This longer drying time may be a more convenient option for the user as the respiration and aggregate stability tests included in the kit already require a 16-24 hour waiting period. Therefore, allowing the soil to dry for a minimum of 24 hours and then proceeding with analysis would not increase the time necessary to complete the tests beyond what is already required. After the ten-minute settling time had elapsed the processing of each sample went very quickly, taking an average of 1 minute per sample. Being able to analyze more than one sample at once is an advantage of this procedure.
All of the chemicals used in the procedure were relatively safe to use. It was necessary to wear safety glasses and use gloves to protect hands from the KMnO4 solution, which can be an irritant to skin. Since the solution permanently stains clothing brown it is also recommended that coveralls be worn.
In terms of cost effectiveness, this procedure requires the use of a colorimeter. A hand-held colorimeter costs $650 (Cdn). This together with the cost of the Soil Quality Test Kit ($500 U.S.) is a major hindrance to including this procedure in the Soil Quality Test Kit.
There are numerous factors to consider when following the procedure of Weil et al. (2003). As we showed in our tests of various methodologies, including settling time, weight of soil used, and dryness of the soil; all affect the accuracy of the results and introduce variability. Although we were able to ensure that dryness and settling time were not an issue, the weight of the soil was still a factor (Appendix 3). The coefficient of variation varied from 2.53 to 9.72 and affects the outcome for the calculated active C values (Table 4). Therefore, it would be best to provide a standardized measuring scoop to all users in order to decrease variability caused by differences in the amount of soil used.
Our results indicate that this method was not able to accurately determine the amount of light fraction carbon in the soils of Alberta. However, it was able to predict the amount of soil organic carbon very well. It was a quantitative procedure that reduced the bias of the user as compared to the qualitative procedure proposed by Bowman (1997).
Basic EDTA field method
The method outlined by Bowman (1997) was simple to follow. The procedure involved making the Basic EDTA reagent, which was a straightforward combination of two chemicals. No calculations were necessary in order to determine the amount of organic carbon. Acquiring the soils with known standard values is a downfall to this protocol. We were able to easily create the standard filtrates because the samples had been analyzed in a lab prior to this study to determine their organic matter contents. However, those employing the method created by Bowman (1997) would not have the same advantage. Therefore, if this method were to be included in the kit an extensive amount of soil samples and information regarding the organic matter contents of soils throughout Alberta would have to be acquired. Providing standard filtrates to the user that accurately represent the area of study would be a costly and time-consuming process. It is also not known how long the filtrates would remain stable and if the color would degrade over time.
In order to overcome these issues it may be possible to use Munsell color chips instead of filtrates to represent the standards for estimating soil organic matter. The unknown filtrates could then be compared to the color chips, avoiding issues of degradation and supplying standard solutions to users.
Creating the standards and the sample filtrates took up to 1 hour to analyze 21 samples (7 samples x 3 reps). The longest part of the procedure is the filtration process. For some soils, especially those higher in clay content, filtering took up to 30 minutes in order to collect enough filtrate to compare to the standards. Like the procedure of Weil et al. (2003) we found that more than one sample can be analyzed at once which speeds up the process.
This procedure was safe to perform and, like the active C method, the only safety requirements were gloves and safety goggles.
This method did not require the utilization of expensive equipment. Costs to provide glass vials, tubes, a mortar and pestle, and various other items in the Soil Quality Test Kit would be minimal.
The Basic EDTA method was developed in the Central Great Plains region of the United States (Bowman and Peterson 1997). Here, the soil organic matter ranges from 1 to 6% with soils typically ranging between 1 and 2% for cultivated soils and between 1.5 and 3% for native grassland. This differs from soils in Alberta where soil organic matter can range from 1-10% for virgin soils (AAFRD 1985) and between 1 and 10% for cultivated soils within the Soil Quality Benchmark sites (Leskiw et al. 2000). Applying the procedure of Bowman (1997) to Alberta soils allowed us to determine how well the test could distinguish between higher levels of organic matter.
When creating the standards we found that it was difficult to distinguish between levels of organic matter greater than 6%. A visual difference could be detected between the 6% and 9% standards and the 10% and 12% standards by holding the glass vials up to a light source. However, distinguishing between 6% and 9% was very difficult and the determination of a sample as 9% only occurred when it was identified as being lighter than 10%, yet darker than 6%. Based on these findings the methodology may have a limited application in Alberta. However, a high degree of accuracy over a 6% organic matter level may not be necessary as soils higher in organic matter (8%) are not fundamentally more fertile or productive than those with less organic matter (5%) (AAFRD 1985).
When creating the 7% standard we found that the color of the filtrate did not correspond to the color gradient of the other standards. It is not known whether the texture or color of the soil affected the resulting filtrate, however, if either of these variables caused the anomaly then the reliability of this test would be reduced.
This method resulted in a reasonably strong relationship between the estimated organic matter and the laboratory determined organic matter values. As the need for determination of higher levels of organic matter may not be necessary this method provides an acceptable level of accuracy for the purposes of the field kit. This procedure is qualitative, but the clear distinction between the standards ranging from 0-6% reduces the user bias. |
|