Download this How To page by : the Adobe Reader URL in the top right corner of this page:
Introduction | Finding_soils_with_similar_attributes
Site_selection_for_a_solar_farm | A_solar_micro-generation_siting-scenario | Identifying_potential_expansion_opportunities | Developing_a_map_for_submission | Printing_a_scaled_site_map
Introduction
In previous “how to” documents on the Alberta Soil Information viewer, the aim was to let clients know:
In this document emphasis will be on three topics:
- Finding soils (soil polygons) that share common attributes to soils found on your farm or area of interest.
- Learning and knowing about soils within a region or custom defined area.
- Learning and knowing about soils along some form of linear transect or feature, some examples would include:
- A transect for an environmental agronomic consultation.
- Determining soil polygons communicating or touching a surface water feature.
- Determining the soil along a transportation or other form of infrastructure corridor.
Finding Soils with Similar Attributes
There can be many reasons for interest in soil polygons with similar soil attributes, some examples include:
- Assessing the suitability for growing food, forage or fibre.
- Targeting marginal crop lands:
- For environmental reclamation projects.
- Renewable energy production such as solar.
- Assessing the relative real estate value in an area.
Whatever the reason, the spatial and soil attribute information may be selected or queried and then exported in a similar fashion regardless of its intended use.
Site selection for a solar farm
Since 2008 and the implementation of the Micro-Generation Regulation, Albertans have been able to generate environmentally friendly electricity and receive credit for any power they send to the power grid as long as it was less than or equal to 1MW.
This regulations provides an opportunity for Albertans to explore several micro-generation opportunities, including photovoltaic electricity generation making use of solar radiation.
Alberta has been gifted with an abundance of solar radiation across the province as indicated by a map of Annual total global solar radiation between 1971 to 2000.
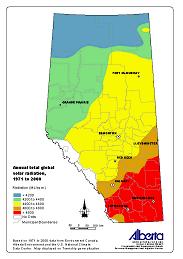
Based on this map, regions of south central and eastern Alberta. Look like the best region of Alberta to explore possible micro-generation opportunities.
Other planning considerations for a micro-generation site selection in southern Alberta include ensuring that any site be, as much as possible:
- Located on land that does not impact native rangeland.
- Or land with the potential for growing high value agricultural crops.
- Within close proximity to existing electrical transmission lines.
Upon inspection of the imagery and soil information in the viewer there are examples in the special areas that meet the above siting criteria for a proposed solar micro-generation installation.
A solar micro-generation siting scenario
A producer in the special areas is running to center pivot irrigation systems and has installed solar panels in the low yielding corners of the fields where the water from the center pivot does not reach. He is close to a major electrical transmission line and so has entered into micro-transmission agreement with the Alberta Utilities Commission (AUC), as a small (less than 150 kilowatts) micro generator.
This producer has plans to expand their irrigation holdings and increase the number of solar installations to become a large (greater than 150 kilowatt micro – generator but less than one megawatt micro-generator. One of the steps towards achieving this goal is to generate a scale map of this expansion plan to the AUC.
One other producer imposed criteria are:
- That the land being sited is available within 5 km to both the existing irrigated fields and
- Within 1 km of the major electrical transmission line. One other stipulation is:
- ·That the land has to of comparable land suitability to land currently developed by the producer.
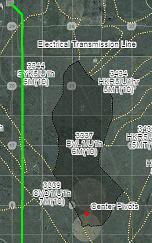
The remainder of this section will describe a process for achieving the producer’s objective of a map for consideration by the AUC.
1. Get the Alberta Soil Information Viewer Started.
2. Turn on the “Imagery with Labels” Base map
3. In the search window enter polygon number 3337 and press of tap the magifying glass.

4. Zoom further until the scale in the bottom right portion of the mapped area is approximately 1 : 4,500.

5. Pan up at this map scale until the transform site has been located and then
6.  Left mouse click or tap the Markup icon located at the bottom of the left side window. Left mouse click or tap the Markup icon located at the bottom of the left side window.
7.  Using a polyline drawing icon in the left hand side markup window begin tracing the transmission line that is captured at this scale in the “Imagery with Labels” base map until a point is reached approximately 5 km (3 sections ) south of the farmers existing center pivots. Using a polyline drawing icon in the left hand side markup window begin tracing the transmission line that is captured at this scale in the “Imagery with Labels” base map until a point is reached approximately 5 km (3 sections ) south of the farmers existing center pivots.
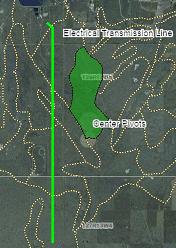
8. In the markup window create a 1km buffer around the Electrical Transmission Line markup by:
a. Entering a value of 1 km in the text box in the “Buffer Creation” area box and changing the buffering units from the default of Metres to Kilometers.
b. Selecting the “Apply buffer on selected markup” radio button option.
c. Left mouse clicking or tapping the Create Buffer button.

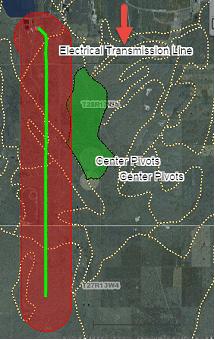
9. From the General Information functioning mode of the left side window record:
a. The north center pivot and a portion of the south center pivot fall in a soil polygon where the land suitability rating for spring seeded small grains is reported as 6M(10).
b. Class 6 land is considered marginal for grow spring seeded small grains. A limitation code of “M” indicates that moisture is the limiting factor according to the Land Suitability Rating System (LSRS) rating for Spring Seeded small grains manual.
c. The bracketed value of 10 indicates that the entire polygon has this rating.
If further investigation into the soil layers is done in the “Specific Information” functioning mode of the left hand side window, it is noted that the soil texture in many of the layers has a high percentage of sand content. This information helps to corroborates the poor water holding capacity (moisture limitation) indicated by the limitation code of “M” reported in the 6M(10) land suitability rating associated with AGRASID soil polygon number 3337.
Identifying potential expansion opportunities
1. Open the select toolbar in the top right hand corner of the mapping area to view all the potential selection icon choices:
a.  Show the “select (soil polygon)” tool bar. Show the “select (soil polygon)” tool bar.
b.  Close the “select (soil polygon)” tool bar. Close the “select (soil polygon)” tool bar.
c.  “Select (soil polygons)” by dragging a rectangle using the mouse or gestures. Soil polygons touching the drawn selection rectagle become selected in the map area of the viewer. “Select (soil polygons)” by dragging a rectangle using the mouse or gestures. Soil polygons touching the drawn selection rectagle become selected in the map area of the viewer.
d.  “Select (soil polygons)” by drawing a multi-segmented polygon using the mouse or gestures. Soil polygons touching all or a portion of the drawn selection polygon become selected in the map area of the viewer. “Select (soil polygons)” by drawing a multi-segmented polygon using the mouse or gestures. Soil polygons touching all or a portion of the drawn selection polygon become selected in the map area of the viewer.
e.  “Select (soil polygons)” by a buffer (see markup tools Location15 for further information on buffer creation). By left mouse clicking or tapping the “select by buffer tool”, and then left mouse clicking or tapping the preferred buffer polygon all soil polygons that touch the buffer polygon will be selected. “Select (soil polygons)” by a buffer (see markup tools Location15 for further information on buffer creation). By left mouse clicking or tapping the “select by buffer tool”, and then left mouse clicking or tapping the preferred buffer polygon all soil polygons that touch the buffer polygon will be selected.
f.  “Select (soil polygons)” by a markup polygon (see markup tools Location15 for further information on point line and polygon markup creation). By left mouse clicking or tapping the “select by markup tool”, and then left mouse clicking or tapping the preferred markup point line or polygon all soil polygons that touch the buffer polygon will be selected. “Select (soil polygons)” by a markup polygon (see markup tools Location15 for further information on point line and polygon markup creation). By left mouse clicking or tapping the “select by markup tool”, and then left mouse clicking or tapping the preferred markup point line or polygon all soil polygons that touch the buffer polygon will be selected.
g.  “Clear selected (soil polygons)” by left mouse clicking or tapping on this icon. “Clear selected (soil polygons)” by left mouse clicking or tapping on this icon.
h. On a final note, the ability to select individual soil polygons may be done with or without initiating the “the select (soil polygon) tool bar” an individual soil polygon may be selected by moving the cursor to the preferred location in the map area of the viewer and then left mouse clicking , or tapping. On a final note, the ability to select individual soil polygons may be done with or without initiating the “the select (soil polygon) tool bar” an individual soil polygon may be selected by moving the cursor to the preferred location in the map area of the viewer and then left mouse clicking , or tapping.
2. Using the “Select (soil polygons)” by a buffer  select the polygons that touch the transmission line 1km buffer by: select the polygons that touch the transmission line 1km buffer by:
a. First selecting or tapping the “Select by buffer” icon and then
b. Selecting the buffer markup. This will cause:
c. AGRASID soil polygons touching the power transmission line 1 km buffer to be highlighted.
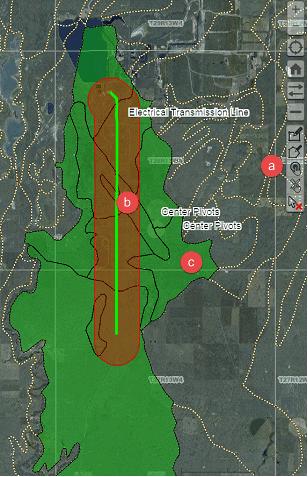
3. At this point there are several ways already covered in the Know there Soil document to discover the LSRS ratings for spring seed small grains.
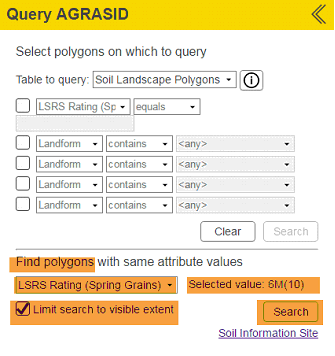
4. In this document we would like to show how to refine the spatial selection previously made above using the “Query AGRASID” functional mode.
iii. Then left mouse click or tap the search button 
iv. In the query results window that appears press the export button,
vi. Close the Query results window.
vii. Clear the polygon selection in the mapping area of the viewer . .
viii. Add “Polygon ID”, “LSRS Value” soil polygon labeling to the mapping area.

ix. Select or tap the soil polygon with Polygon ID: 3337.
x. Zoom to a scale of approximately 1: 72,000.
xi. Go back to the Query AGRASID functioning mode of the left hand side window.
xii. Search  polygons with the same LSRS Rating (Spring Grains) attribute value of AGRASID Polygon: 3337 {LSRS: 6M(10) }. polygons with the same LSRS Rating (Spring Grains) attribute value of AGRASID Polygon: 3337 {LSRS: 6M(10) }.
Developing a map for submission
Base on the information in the previous section, the producer has been able to secure land contained in AGRASID Soil Polygon number 3344 and 3341 and prepares a scale map of his proposed solar installations:
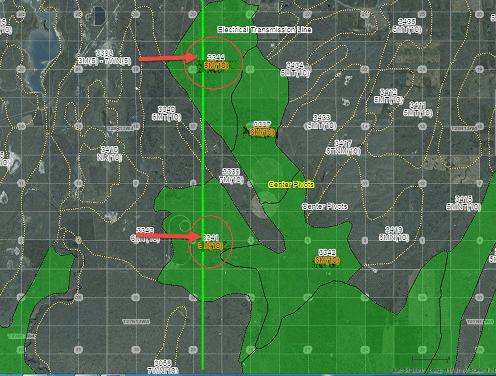
1.  Clear the selection of all previously selected soil polygons. Clear the selection of all previously selected soil polygons.
2. Select soil polygons 3344, 3341 and 3339.
3.Export these selected soil polygons as a win zipped compressed kml layer (*.kmz)
4.  Clear the selection of soil polygons 3344, 3341, and 3339. Clear the selection of soil polygons 3344, 3341, and 3339.
5. Import the win zipped compressed kml layer (default name: _ags_SoilInformation.kmz) of the soil polygons. 6. Change to the markup window  and in the mark window select the “delete a selected markup” tool and in the mark window select the “delete a selected markup” tool  . .
7. Select and delete polygon: 3339.
8.  Place a circular mark up in quarter section: SW-28-028-13-4 to represent one of the proposed center pivot irrigation sites and another in the NW-04-027-13-4 to represent the other of the proposed center pivots. Place a circular mark up in quarter section: SW-28-028-13-4 to represent one of the proposed center pivot irrigation sites and another in the NW-04-027-13-4 to represent the other of the proposed center pivots.
9. Label the circle in SW-28-028-13-4 “Proposed pivot site 1”, and the circle in NW-04-027-13-4 “Proposed pivot site 2”  , ,  . .
10.  Using the freehand drawing tool draw in a proposed solar site in the south east corner of SW-28-028-13-4. Using the freehand drawing tool draw in a proposed solar site in the south east corner of SW-28-028-13-4.
11.  Adjust boundary along the boundary of the proposed centre pivot site. Adjust boundary along the boundary of the proposed centre pivot site.
12. Label this site “Future Solar Installation ” 
Printing a scaled site map
The follow section is not a detailed discussion on topic of printing and screen capture. For further information this subject please refer to the “How To” document: Run the Alberta Soil Information Viewer in the section titled: Location 16: Printing and Screen Capture.
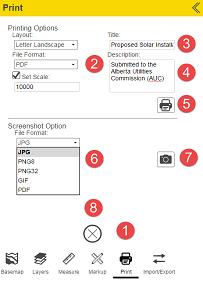
1.  Left mouse Click or tap the print icon at the bottom of the functioning mode left side window. Left mouse Click or tap the print icon at the bottom of the functioning mode left side window.
2. Print a map on letter (8 ½ “ X 11”) paper, in landscape, adobe print document format (PDF), at scale of 1:10,000 for SW-28-028-13-4.
3. Title the map: Proposed Solar Installation SW-28-028-13-4 .
4. In the Description type: Submitted to the Alberta Utilities Commission (AUC).
5. Left mouse click or tap the print button. Left mouse click or tap the print button.
6. In addition to a scaled map create a screen capture in one of five image formats:
a. JPG
b. PNG 8
c. PNG 32
d. GIF
e. PDF
7.  Left mouse click or tap the screen capture button. Left mouse click or tap the screen capture button.
What happens to the screen capture is browser and device dependant. Please follow standard protocols for saving and managing imagery on your device and browser.
8.  Upon completion of the scale printing and screen capture activity exit the printing window by left mouse clicking or tapping on the “close” button located at the bottom of the left hand side window. Upon completion of the scale printing and screen capture activity exit the printing window by left mouse clicking or tapping on the “close” button located at the bottom of the left hand side window.
This concludes the “How To Find Your Soil” document. For further details of other tasks such as how to; Run the Viewer, Find their Farm, Know there Soil. or return to the Alberta Soil Information Viewer Welcome Page and browse the “Read How to:” or “Watch How to:” sections of the welcome page.

Contact the Ag-Info Centre, toll-free in Alberta at 310-FARM (3276), for further soil viewer and agricultural information.
02092017 |