| | Purpose of survey | Methodology | Survey results | Acknowledgments
.......
.Purpose of Survey - By Maureen Wenger
To address some of the data and information needs of the specialty crop industry in Alberta, the Statistics and Data Development (SADD) Branch has been conducting an annual Specialty Crop Survey. Now into its twenty-first year, the survey attempts to capture data on area (seeded and harvested acres), yield and production for the various types of specialty crops grown in Alberta.
Data gathered from the survey are used primarily to generate related provincial and sub-provincial estimates by the SADD Branch. In turn, these estimates are used to validate some of the Alberta estimates generated by Statistics Canada, as well as to provide industry and other stakeholders with benchmark statistics for some of the "new" and emerging crops grown in the province.
Methodology
The Alberta Specialty Crop Survey, which is provincial in scope, collects data through a non-probability sampling procedure. In December 2003, survey questionnaires were mailed out to 3,607 specialty crop producers across Alberta. The questionnaires specifically asked survey participants to provide information on the type of specialty crop grown, area (seeded and harvested acres), yield and production for the year 2003. Survey participants were also made aware that participation in the survey was voluntary. Moreover, all individual responses would be kept confidential under the provisions of the Federal Statistics Act, as well as under the Provincial Freedom of Information and Protection of Privacy (FOIP) Act, by which the SADD Unit is governed and operates. As of March 16, 2004, a total of 1,045 questionnaires were returned. Of this total 921 were usable and formed part of the basis in the generation of the Alberta 2003 specialty crop estimates.
Survey responses received were reviewed for data completeness, validated and entered into an electronic database. The data was then subject to some computerized analyses, the results of which were rolled up into group summaries, to preserve data confidentiality of individual survey respondents. In turn, the group summaries, in conjunction with consultations with industry, published sources (e.g. Statistics Canada) and Alberta Agriculture and Rural Development (ARD) subject area/provincial specialists were used to generate the provincial and sub-provincial (Census Division) estimates, where appropriate.
It cannot be over emphasized that extensive consultation is done with ARD's subject area/provincial specialists and industry, in the derivation of the provincial/sub-provincial estimates. Subject area/provincial specialists are acknowledged for their useful information and valuable insights on crop conditions and yields, particularly when attempting to firm up some of the sub-provincial estimates generated from the survey. Likewise, administrative data showing yield and crop area grown under private contracts also tend to add value to some of the estimates.
It should be noted that the derived estimates are subject to error. Some of the possible causes of error include data coding, entry editing and tabulation. Nonetheless, we believe that the statistics published in this report are reliable estimates for Alberta.
Survey Results - By Chuanliang Su
Area, yield and production in Alberta
Following two consecutive dry years, the 2003 crop season began under favorable moisture conditions. Soil moisture reserves were mostly rated as good to excellent in the spring of 2003. However, lack of precipitation in the summer reduced yield potential of specialty crops grown on dryland.
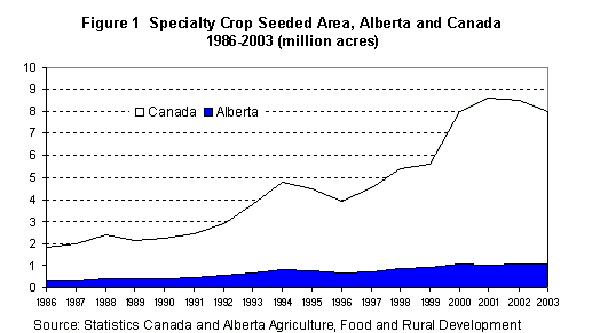
The upward trend in specialty crop area continued in 2003, with total seeded area reaching a record high of 1.06 million acres in Alberta - Figure 1 (excluding potatoes and forage seeds). This represented an increase of two per cent from 1.04 million acres in 2002. The record seeded acreage in 2003 can be attributed to the need for crop rotation and diversification, as well as good cash returns for some specialty crops. Nearly 0.95 million acres or 90 per cent of total seeded area were harvested for grains. Percentage distribution of 2003 specialty crop seeded acreage by crop type is presented in Figure 3.
Yields for most specialty crops grown on dryland in 2003 were below the 10-year average levels. For example, dry peas produced an average yield of 30.8 bushels per acre, about 13 per cent below the 10-year average. Above average yields, however, were achieved for specialty crops grown under irrigation in southern Alberta, including potatoes, sugar beets and dry beans.
On June 29, 2004, Statistics Canada is expected to release estimates of 2004 seeded area for major crops as well as some specialty crops by province.
Specialty crops in Western Canada
Producers in Western Canada planted fewer acres of specialty crops in 2003, according to Statistics Canada's November Estimate of Production of 2003 Principal Field Crops and the Alberta 2003 Specialty Crop Survey. Seeded acreage in both Saskatchewan and Manitoba was lower than a year ago, which more than offset the higher area in Alberta. However, total harvested area and average yields in Western Canada increased significantly from 2002, due to improved growing conditions. As a result, total production of specialty crops in 2003 was much higher than a year ago.
Total seeded area of specialty crops in Western Canada was estimated at 7.44 million acres in 2003. Of this total, 5.35 million acres or 72 per cent were in Saskatchewan. Alberta accounted for 14 per cent of the total seeded area, Manitoba 13 per cent, and British Columbia one per cent. A total of 7.10 million acres of specialty crops were harvested in Western Canada in 2003, compared to 6.11 million acres in 2002.
Dry peas remained the largest specialty crop in Western Canada in 2003, with total seeded area estimated at 3.22 million acres. A total of 2.12 million tonnes of dry peas were produced from 3.14 million acres harvested. Total harvested area of lentils was estimated at 1.32 million acres and production at 0.52 million tonnes. Total production of mustard was 0.23 million tonnes from a total harvested area of 0.81 million acres. In addition, about 0.22 million tonnes of canary seed were produced from 0.60 million acres harvested. Harvested area of major specialty crops is shown in Figure 2. Statistics on seeded area and production of selected specialty crops are presented in Table 5.
Table 1 Alberta 2003 Specialty Crops
| Seeded area | Harvested area | Yield | Production |
| (acres) | (acres) | (per acre) | (tonnes) |
| Pulse crops | Dry peas, green Dry peas, yellow Dry peas, other Total dry peas Chickpeas Dry beans Fababeans Lentils | 215,000 408,000 12,000 635,000 25,000 52,000 2,000 15,000 | 205,000 390,000 10,000 605,000 25,000 52,000 2,000 15,000 | 32.0 bu 30.1 bu 36.2 bu 30.8 bu 1,160 lbs 25.6 cwt -1,013 lbs | 178,533 319,481 9,852 507,865 13,155 60,300 -6,891 |
| Oilseeds | Brown mustard Yellow mustard Oriental mustard Total mustard Sunflowers Safflowers | 14,000 113,500 12,500 140,000 3,000 2,500 | 13,000 110,000 12,000 135,000 3,000 2,500 | 530 lbs 658 lbs 527 lbs 634 lbs -1,215 lbs | 3,125 32,831 2,869 38,825 -1,378 |
| Corn | Grain corn | - | - | - | - |
 | Silage corn | 40,000 | 30,000 | 16.7 ton | 453,606 |
| Other | Potatoes (1) Triticale Canary seed Sugar beets (2) | 66,000 110,000 10,000 27,831 | 61,000 40,000 10,000 27,389 | 330 cwt 33.8 bu 900 lbs 22.9 tonne | 913,200 34,343 4,082 628,081 |
| Forage seeds (3) | Alfalfa seed Alsike clover | 11,292 530 | 11,292 530 | 550 lbs - | 2,817 - |
| Brome grass Red fescue Timothy Other | 11,035 5,927 7,647 14,350 | 11,035 5,927 7,647 14,350 | 570 lbs 310 lbs 395 lbs - | 2,853 833 1,370 - |
Table 2 Alberta 2003 Specialty Crops by Census Division
| C.D. | Dry Peas | Mustard | Lentils | Dry Beans | Chickpeas |
| | Harvested Area (acres) | | |
| 1 | 46,553 | 12,137 | 5,701 | 27,449 | 15,391 |
| 2 | 47,119 | 57,032 | 6,016 | 22,818 | 6,382 |
| 3 | 18,645 | 7,638 | - | - | - |
| 4 | 39,816 | 27,901 | 889 | - | 395 |
| 5 | 79,251 | 26,976 | 2,394 | 588 | 2,832 |
| 6 | 34,048 | 1,138 | - | 642 | - |
| 7 | 75,317 | 1,608 | - | - | - |
| 8 | 17,114 | - | - | - | - |
| 9 | - | - | - | - | - |
| 10 | 106,897 | 569 | - | - | - |
| 11 | 26,957 | - | - | - | - |
| 12 | 12,673 | - | - | - | - |
| 13 | 14,063 | - | - | 503 | - |
| 17 | 45,421 | - | - | - | - |
| 18 | 2,717 | - | - | - | - |
| 19 | 38,412 | - | - | - | - |
| Alberta | 605,000 | 135,000 | 15,000 | 52,000 | 25,000 |
| | Yield Per Acre | | |
| (bushels) | (pounds) | (pounds) | (cwt) | (pounds) |
| 1 | 25.7 | 810.5 | - | 25.5 | 1,092.4 |
| 2 | 29.5 | 743.4 | 1,147.1 | 25.8 | 1,322.1 |
| 3 | 35.5 | 583.7 | - | - | - |
| 4 | 17.1 | 287.0 | - | - | - |
| 5 | 27.0 | 718.2 | - | - | - |
| 6 | 35.7 | - | - | - | - |
| 7 | 27.6 | - | - | - | - |
| 8 | 33.8 | - | - | - | - |
| 9 | - | - | - | - | - |
| 10 | 34.6 | - | - | - | - |
| 11 | 44.7 | - | - | - | - |
| 12 | 36.4 | - | - | - | - |
| 13 | 40.7 | - | - | - | - |
| 17 | 35.6 | - | - | - | - |
| 18 | 34.7 | - | - | - | - |
| 19 | 27.4 | - | - | - | - |
| Alberta | 30.8 | 634.0 | 1,013.0 | 25.6 | 1,160.0 |
| | Production (tonnes) | | |
| 1 | 32,584 | 4,462 | - | 31,692 | 7,627 |
| 2 | 37,775 | 19,231 | 3,130 | 26,667 | 3,827 |
| 3 | 18,002 | 2,022 | - | - | - |
| 4 | 18,480 | 3,632 | - | - | - |
| 5 | 58,224 | 8,788 | - | - | - |
| 6 | 33,042 | - | - | - | - |
| 7 | 56,642 | - | - | - | - |
| 8 | 15,759 | - | - | - | - |
| 9 | - | - | - | - | - |
| 10 | 100,557 | - | - | - | - |
| 11 | 32,785 | - | - | - | - |
| 12 | 12,550 | - | - | - | - |
| 13 | 15,567 | - | - | - | - |
| 17 | 43,967 | - | - | - | - |
| 18 | 2,569 | - | - | - | - |
| 19 | 28,602 | - | - | - | - |
| Alberta | 507,865 | 38,825 | 6,891 | 60,300 | 13,155 |
Note: Totals may not add up due to rounding or insufficient data for generating estimates for some census divisions. cwt - hundredweight (hundred pounds) - Not available Source: Statistics Canada; and Alberta Agriculture and Rural Development (ARD)
Table 3 Alberta 2002 Specialty Crops by Census Division
| C.D. | Dry Peas | Mustard | Lentils | Dry Beans | Chickpeas |
| | Harvested Area (acres) | | |
| 1 | 14,131 | 12,170 | - | 16,812 | 6,950 |
| 2 | 27,325 | 32,277 | 5,616 | 22,309 | 30,219 |
| 3 | 24,021 | 7,057 | 3,187 | - | - |
| 4 | 4,215 | 11,747 | 797 | - | 852 |
| 5 | 89,912 | 12,949 | - | 879 | 11,624 |
| 6 | 26,106 | 674 | - | - | 355 |
| 7 | 52,363 | 3,127 | - | - | - |
| 8 | 18,786 | - | - | - | - |
| 9 | - | - | - | - | - |
| 10 | 69,493 | - | - | - | - |
| 11 | 25,790 | - | - | - | - |
| 12 | 8,870 | - | - | - | - |
| 13 | 18,944 | - | - | - | - |
| 17 | 31,418 | - | - | - | - |
| 18 | 3,010 | - | - | - | - |
| 19 | 25,618 | - | - | - | - |
| Alberta | 440,000 | 80,000 | 12,000 | 40,000 | 50,000 |
| | Yield Per Acre | | |
| (bushels) | (pounds) | (pounds) | (cwt) | (pounds) |
| 1 | 26.5 | 515.0 | - | 21.0 | 1,700.0 |
| 2 | 38.8 | 695.0 | 1,170.0 | 20.2 | 1,600.0 |
| 3 | 34.1 | 1,085.0 | - | - | - |
| 4 | 9.6 | 215.0 | - | - | - |
| 5 | 16.6 | 685.0 | - | - | 1,450.0 |
| 6 | 27.5 | - | - | - | - |
| 7 | 7.9 | - | - | - | - |
| 8 | 22.6 | - | - | - | - |
| 9 | - | - | - | - | - |
| 10 | 9.6 | - | - | - | - |
| 11 | 19.5 | - | - | - | - |
| 12 | 13.0 | - | - | - | - |
| 13 | 23.1 | - | - | - | - |
| 17 | 20.9 | - | - | - | - |
| 18 | 35.2 | - | - | - | - |
| 19 | 30.2 | - | - | - | - |
| Alberta | 19.6 | 603.0 | 900.0 | 20.5 | 1,608.0 |
| | Production (tonnes) | | |
| 1 | 10,173 | 2,843 | - | 16,014 | 5,359 |
| 2 | 28,834 | 10,175 | 2,980 | 20,441 | 21,932 |
| 3 | 22,288 | 3,473 | - | - | - |
| 4 | 1,095 | 1,146 | - | - | - |
| 5 | 40,662 | 4,023 | - | - | 7,645 |
| 6 | 19,541 | - | - | - | - |
| 7 | 11,296 | - | - | - | - |
| 8 | 11,572 | - | - | - | - |
| 9 | - | - | - | - | - |
| 10 | 18,062 | - | - | - | - |
| 11 | 13,674 | - | - | - | - |
| 12 | 3,135 | - | - | - | - |
| 13 | 11,915 | - | - | - | - |
| 17 | 17,883 | - | - | - | - |
| 18 | 2,887 | - | - | - | - |
| 19 | 21,040 | - | - | - | - |
| Alberta | 234,324 | 21,888 | 4,899 | 37,195 | 36,474 |
Note: Totals may not add up due to rounding or insufficient data for generating estimates for some census divisions. cwt - hundredweight (hundred pounds) - Not available Source: Statistics Canada; and Alberta Agriculture and Rural Development (ARD)
Table 4 Alberta Specialty Crops Historical Series
| 1994 | 1995 | 1996 | 1997 | 1998 | 1999 | 2000 | 2001 | 2002* | 2003* |
| Alfalfa Seed (1) | | | | | | | | | |
| Inspected area | (acres) | 13,116 | 12,851 | 10,355 | 10,376 | 12,069 | 16,461 | 17,117 | 15,381 | 12,709 | 11,292 |
| Yield | (lbs/acre) | 340 | 265 | 265 | 300 | 425 | 200 | 525 | 385 | 265 | 550 |
| Production | (tonnes) | 2,023 | 1,545 | 1,245 | 1,412 | 2,327 | 1,493 | 4,076 | 2,686 | 1,528 | 2,817 |
| Buckwheat | | | | | | | | | | | |
| Harvested area | (acres) | 500 | 850 | 850 | 400 | 400 | 400 | - | - | - | - |
| Yield | (bu/acre) | - | - | - | - | - | - | - | - | - | - |
| Production | (tonnes) | - | - | - | - | - | - | - | - | - | - |
| Canary Seed | | | | | | | | | | | |
| Harvested area | (acres) | - | 10,000 | 25,000 | 10,000 | 20,000 | 10,000 | 10,000 | 4,000 | 7,000 | 10,000 |
| Yield | (lbs/acre) | - | 990 | 960 | 810 | 950 | 1,400 | 1,100 | 775 | 520 | 900 |
| Production | (tonnes) | - | 4,500 | 10,900 | 3,700 | 8,600 | 6,400 | 5,000 | 1,400 | 1,651 | 4,082 |
| Corn for Grain | | | | | | | | | | | |
| Harvested area | (acres) | 5,000 | 5,000 | 2,600 | 4,000 | 5,000 | 10,000 | 10,000 | 3,000 | - | - |
| Yield | (bu/acre) | 100.0 | 100.0 | 96.2 | 100.0 | 90.0 | 80.0 | 110.0 | 86.7 | - | - |
| Production | (tonnes) | 12,700 | 12,700 | 6,400 | 10,200 | 11,400 | 20,300 | 27,900 | 6,600 | - | - |
| Corn Silage | | | | | | | | | | | |
| Harvested area | (acres) | 10,000 | 10,000 | 10,000 | 15,000 | 15,000 | 15,000 | 30,000 | 30,000 | 30,000 | 30,000 |
| Yield | (tons/acre) | 20.0 | 16.0 | 19.5 | 12.0 | 20.0 | 13.3 | 17.0 | 16.0 | 16.0 | 16.7 |
| Production | (tonnes) | 181,400 | 145,100 | 176,900 | 163,300 | 272,200 | 181,400 | 462,700 | 435,400 | 435,453 | 453,606 |
| Fababeans | | | | | | | | | | | |
| Harvested area | (acres) | - | - | 200 | 1,000 | 2,000 | - | - | 3,000 | 2,500 | 2,000 |
| Yield | (lbs/acre) | - | - | 1,300 | 2,000 | 2,500 | - | - | 1,700 | 1,450 | - |
| Production | (tonnes) | - | - | 120 | 900 | 2,300 | - | - | 2,300 | 1,644 | - |
| Dry Beans | | | | | | | | | | | |
| Harvested area | (acres) | 25,000 | 30,000 | 25,000 | 35,000 | 45,000 | 47,000 | 45,000 | 59,000 | 40,000 | 52,000 |
| Yield | (cwt/acre) | 32.0 | 20.0 | 18.0 | 22.9 | 22.2 | 20.0 | 21.3 | 22.3 | 20.5 | 25.6 |
| Production | (tonnes) | 36,300 | 27,200 | 20,400 | 36,300 | 45,400 | 42,700 | 43,500 | 59,700 | 37,195 | 60,300 |
| Dry Peas | | | | | | | | | | | |
| Harvested area | (acres) | 390,000 | 445,000 | 280,000 | 385,000 | 500,000 | 455,000 | 640,000 | 570,000 | 440,000 | 605,000 |
| Yield | (bu/acre) | 35.3 | 34.0 | 40.4 | 40.3 | 35.9 | 42.9 | 35.6 | 32.6 | 19.6 | 30.8 |
| Production | (tonnes) | 374,200 | 412,300 | 307,500 | 421,800 | 488,000 | 530,800 | 620,500 | 506,200 | 234,324 | 507,865 |
| Lentils | | | | | | | | | | | |
| Harvested area | (acres) | 40,000 | 38,000 | 20,000 | 25,000 | 15,000 | 22,000 | 32,000 | 15,000 | 12,000 | 15,000 |
| Yield | (lbs/acre) | 1,075 | 1,250 | 845 | 732 | 1,180 | 1,245 | 684 | 722 | 900 | 1,013 |
| Production | (tonnes) | 19,500 | 21,500 | 7,700 | 8,300 | 8,000 | 12,400 | 9,900 | 5,000 | 4,899 | 6,891 |
| Mustard Seed | | | | | | | | | | | |
| Harvested area | (acres) | 90,000 | 100,000 | 85,000 | 145,000 | 110,000 | 90,000 | 50,000 | 50,000 | 80,000 | 135,000 |
| Yield | (lbs/acre) | 889 | 1,125 | 753 | 769 | 795 | 1,100 | 606 | 373 | 603 | 634 |
| Production | (tonnes) | 36,300 | 51,100 | 29,000 | 50,600 | 39,700 | 44,800 | 13,800 | 8,500 | 21,888 | 38,825 |
| Safflower | | | | | | | | | | | |
| Harvested area | (acres) | 2,000 | 2,000 | 800 | - | 12,000 | 5,000 | 3,000 | 1,000 | - | 2,500 |
| Yield | (lbs/acre) | 500 | 870 | 760 | - | 1,020 | 900 | 625 | 750 | - | 1,215 |
| Production | (tonnes) | 1,100 | 2,000 | 700 | - | 1,400 | 2,000 | 900 | 300 | - | 1,378 |
| Sugar Beets (2) | | | | | | | | | |
| Harvested area | (acres) | 34,836 | 33,656 | 33,463 | 33,124 | 41,132 | 44,522 | 42,017 | 28,457 | 27,754 | 27,389 |
| Yield | (tonnes/acre) | 21.17 | 20.46 | 20.22 | 19.64 | 23.32 | 18.86 | 21.90 | 18.38 | 15.22 | 22.90 |
| Production | (tonnes) | 737,774 | 688,498 | 676,611 | 650,423 | 959,310 | 839,773 | 920,252 | 523,110 | 422,389 | 628,081 |
| Sunflowers | | | | | | | | | | | |
| Harvested area | (acres) | 5,000 | 5,000 | 2,000 | 5,000 | 5,000 | 5,000 | 5,000 | 5,000 | 2,000 | 3,000 |
| Yield | (lbs/acre) | 2,000 | 1,900 | 1,675 | 1,400 | 1,900 | 1,600 | 2,240 | 1,250 | 1,500 | - |
| Production | (tonnes) | 4,500 | 4,300 | 1,500 | 3,200 | 4,300 | 3,600 | 5,100 | 2,800 | 1,361 | - |
| Triticale | | | | | | | | | | | |
| Harvested area | (acres) | 10,000 | 10,000 | 15,000 | 15,000 | 50,000 | 60,000 | 50,000 | 20,000 | 35,000 | 40,000 |
| Yield | (bu/acre) | 40.0 | 50.0 | 33.3 | 36.7 | 38.0 | 53.3 | 41.0 | 37.0 | 50.0 | 33.8 |
| Production | (tonnes) | 10,200 | 12,700 | 12,700 | 14,000 | 48,300 | 81,300 | 52,100 | 18,800 | 44,452 | 34,343 |
| Potatoes | | | | | | | | | | | |
| Harvested area | (acres) | 29,000 | 29,500 | 31,000 | 30,500 | 32,200 | 42,300 | 47,700 | 57,300 | 55,800 | 61,000 |
| Yield | (cwt/acre) | 277.8 | 297.7 | 268.0 | 290.0 | 295.0 | 290.0 | 310.0 | 315.0 | 280.0 | 330.0 |
| Production | (tonnes) | 365,500 | 398,400 | 376,900 | 401,200 | 430,900 | 556,400 | 670,700 | 818,700 | 708,700 | 913,200 |
Source: Statistics Canada; and Alberta Agriculture and Rural Development (ARD) - Not available
(1) Inspected pedigreed acres are from Canadian Seed Growers' Association; yield and production data are from the Alberta Specialty Crop Survey
(2) Alberta Sugar Beet Growers, Annual Report Note: * Data shown in 2002 and 2003 are from Alberta Specialty Crop Survey, ARD.
Note: * Data shown in 2002 and 2003 are from Alberta Specialty Crop Survey, ARD.
Acknowledgments
The Statistics and Data Development Branch of Alberta Agriculture and Rural Development (ARD) wishes to thank all of the producers that participated in the specialty crop survey conducted in the winter of 2003/2004. Without their cooperation and assistance, this report would not have been possible.
In addition, contributions to this report from Alberta Agriculture and Rural Development staff, including Chuanliang Su of Statistics and Data Development Branch, Charlie Pearson of Strategic Information Services Branch, Nabi Chaudhary of Economics Branch, and Dr. Stan Blade, Neil Clark, K. Ampong-Nyarko, Manjula Bandara, Carina Weisbach, Judy Webber, and Debbie Schuiling, of Crop Diversification Division, are very much appreciated.
Participation of the Survey Services Team of Economics and Competitiveness Division of ARD, including Maureen Wenger, Shukun Guan, and Guangzhi Liu who conducted and provided assistance to the Alberta 2003 Specialty Crop Survey, is acknowledged and appreciated. Finally, thanks to several Statistics and Data Development Branch staff members for their assistance with the report, including: Gail Atkinson, Melodie Mynzak and Marion Elson.
For the complete survey report click: 2004 Alberta Specialty Crop Results.pdf |
|