| | Purpose of survey | Methodology | Survey results | Specialty crops by census division in Alberta | Markets for selected specialty crops | Economics of specialty crop production | Acknowledgment | Contact
.
Purpose of Survey
To address some of the data and information needs of the specialty crop industry in Alberta, the Alberta Agriculture and Forestry, Economics and Competitiveness Branch, Statistics and Data Development Section conducts an annual specialty crop survey. Now into its twenty-eighth year, the survey captures data on area, yield and production for specialty crops grown in the province.
Data gathered from the survey are used primarily to generate related provincial and sub-provincial (Census Division) estimates. In turn, these estimates are used to validate some of the Alberta statistics produced by Statistics Canada, as well as to provide industry and other stakeholders with benchmark data for some of the “new” and emerging crops
Methodology
The Alberta Specialty Crop Survey, which is provincial in scope, collects data through a non-probability sampling procedure. In December 2010, survey questionnaires were mailed out to 3,590 specialty crop producers across the province. The questionnaires specifically asked survey participants to provide information on the type of specialty crop grown, area (seeded and harvested acres), and yield for 2010. Survey participants were informed that participation in the survey was voluntary. Moreover, all individual responses are kept confidential under the provisions of the Federal Statistics Act, as well as under the Provincial Freedom of Information and Protection of Privacy (FOIP) Act. As of June 7, 2011, a total of 874 questionnaires were returned. Of this total, 733 were usable and partly formed the basis in the generation of the Alberta 2010 specialty crop estimates.
Survey responses received were reviewed for data completeness, validated and entered into an electronic database. The data was then subjected to computerized analyses, the results of which were rolled up into group summaries, to preserve data confidentiality of individual survey respondents. In turn, the group summaries, in conjunction with information from provincial specialists of ARD, industry, and published sources (e.g. Statistics Canada), were used to generate the provincial and sub-provincial (Census Division) estimates, where appropriate.
It cannot be over emphasized that extensive consultation is done with ARD’s provincial specialists and industry in the development of the provincial/sub-provincial estimates. Provincial specialists are acknowledged for the invaluable insights they offer on crop conditions and yields, particularly when attempting to firm up some of the sub-provincial estimates generated from the survey. Similarly, administrative data on yield and crop area grown under private contracts also add value to the estimates.
It should be noted that the estimates are subject to error. Some of the possible sources of error include data coding, data entry and tabulation. Nonetheless, we believe that the statistics published in this report are reliable estimates for Alberta.
Survey Results
Area, yield and production in Alberta
In Alberta the term "specialty crops" refer to the following crops: dry peas, chick peas, dry beans, fababeans, lentils, mustard seed, sunflower seed, grain corn, silage corn, triticale, canary seed, sugar beets, potatoes, forage seeds and other field crops.
In 2010, the seeded area of specialty crops was significantly higher compared to a year earlier. Crop rotation and diversification, as well as good economic returns for some specialty crops were the key drivers for increased acreage. The total provincial seeded area, excluding potatoes and forage seeds, was estimated at 1.39 million acres, up 10 per cent, from 1.24 million acres in 2009 (see Figure 1). Of the total seeded area, 1.27 million acres or 94 per cent were harvested for grain production. To offer some perspective, shown in Figure 3 on page 4 is the percentage distribution of specialty crop seeded acreage in 2010, by crop type (i.e., pulse crops, oilseeds, corn, forage seeds, and other crops).
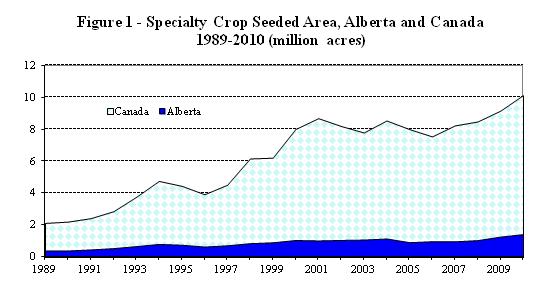
Source: Statistics Canada; and Alberta Agriculture and Rural Development
The 2010 growing season was affected by cool, wet weather in spring and early summer that resulted in delayed crops throughout the rest of the season. Above seasonal temperatures during September and October provided producers with the opportunity to make good harvest progress with the additional benefit of above average crop quality. However, due to damp weather in the northern part of the province, many crops were taken off wet and required drying.
Provincial average yields were above their respective 10-year averages (2001-2010) outlined in Tables 1 and 4. The provincial average yield for dry peas in 2010 was estimated at 39.0 bushels per acre. This was 19 per cent higher than in 2009, and 14 per cent above the 10-year average. With the majority of its acreage in southern Alberta, mustard seed produced an average yield of 1,052.0 pounds per acre in 2010, or 15 per cent higher than in 2009, and 35 per cent above the 10-year average. For triticale, the provincial average yield was 60.0 bushels per acre, 20 per cent higher than in 2009, and 39 per cent above the 10-year average.
The estimated provincial average yields for specialty crops under irrigation were below the 10-year average. For dry beans, the provincial average yield was estimated at 1,760.0 pounds per acre, or 21 per cent lower than the 10-year average. For potatoes, the provincial average yield was 314 cwt per acre, or four per cent below the 10-year average. The provincial average yield for sugar beets was 20.0 tonnes per acre, compared to 21.4 tonnes per acre for the 10-year average.
Specialty crops in Western Canada
The results of "Alberta 2010 Specialty Crop Survey", Statistics Canada’s "November Estimate of Production of Principal Field Crops, Canada, 2010" and "September Estimate of Production of Principal Field Crops, Canada, 2011" indicate that total seeded and harvested acres of specialty crops in Western Canada in 2010 increased from a year earlier. This stemmed from larger areas in all provinces in Western Canada.
In 2010, the total seeded area of specialty crops in Western Canada was estimated at 9.53 million acres, up 12 per cent from 8.49 million acres in 2009. On a provincial basis, Saskatchewan with 6.97 million acres, accounted for 73 per cent of the Western Canada total, while Alberta and Manitoba accounted for 15 per cent and 12 per cent, respectively. The specialty crop seeded area in British Columbia was extremely small, less than one per cent of the Western Canadian total. Similar to seeded area, the total harvested acreage in 2010 increased 10 per cent from a year earlier, to 8.96 million acres.
Source: Statistics Canada; and Alberta Agriculture and Rural Development
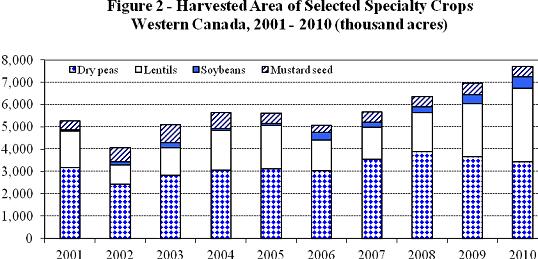
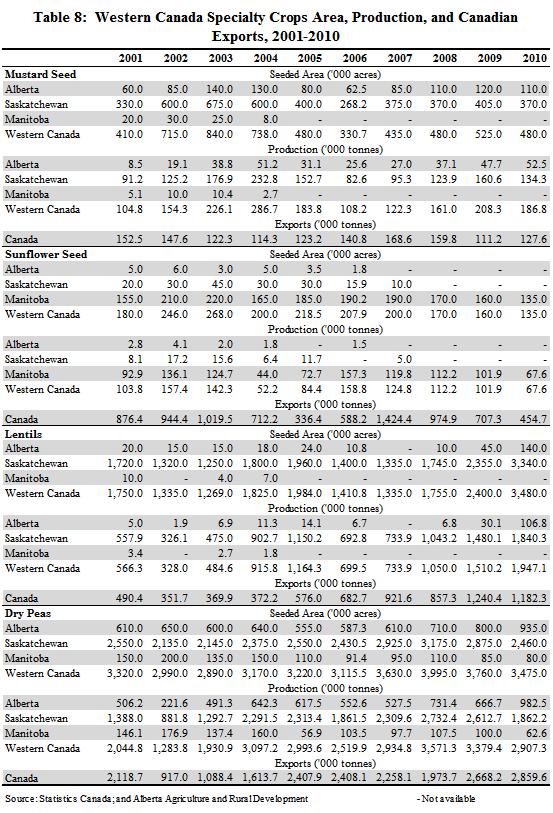
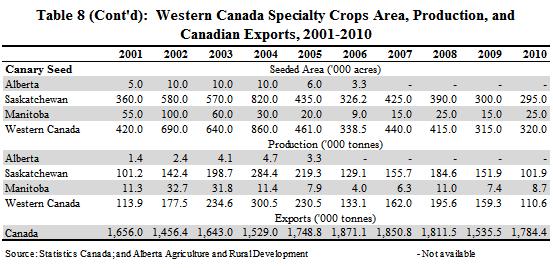
The four largest specialty crops grown in Western Canada in 2010 were dry peas, lentils, soybeans and mustard seed. Together, these crops accounted for eight million acres, or 84 per cent of the total area seeded of specialty crops. Dry peas was the largest specialty crop, accounting for 3.63 million acres, or 38 per cent of the Western Canada total. Lentils were next, with seeded acres totaling 3.48 million acres (37 per cent of the total), while soybeans (520,000 acres) and mustard seed (480,000 acres) represented six per cent and five per cent, respectively. Shown in Figure 2 below is the harvested area of the top four specialty crops in Western Canada. Historical statistics on seeded area and production for selected specialty crops are presented in Table 8 on page 16 and 17.
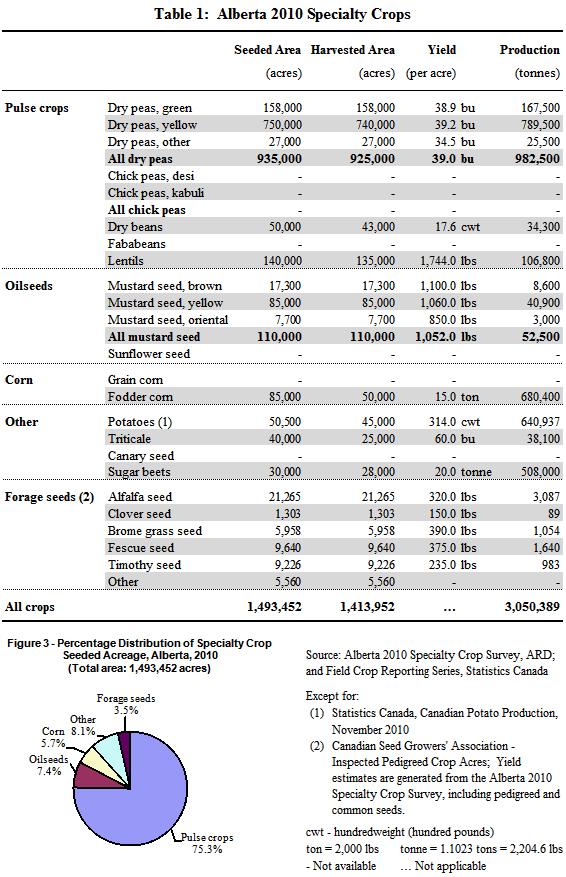
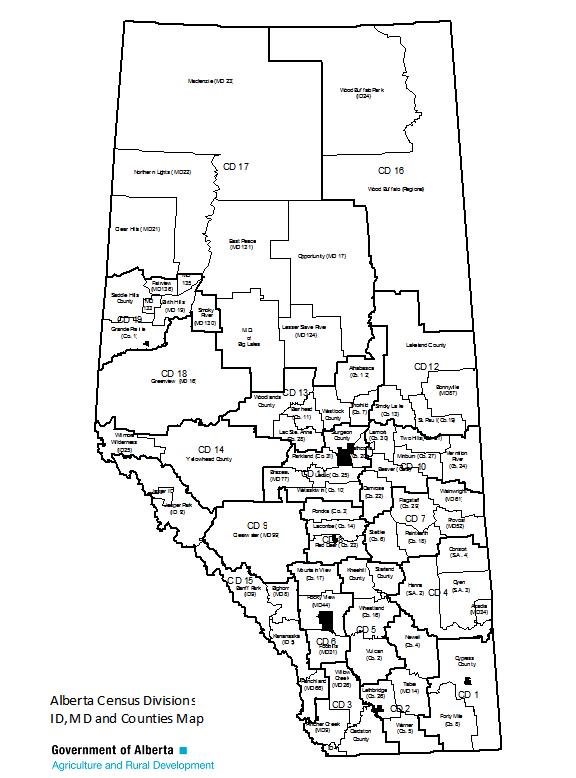
Figure 4
Specialty Crops by Census Division in Alberta
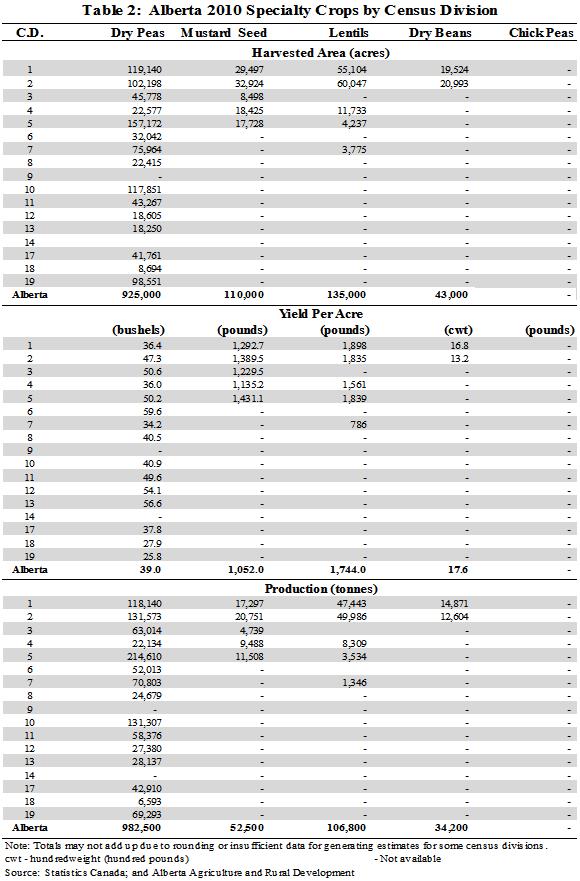
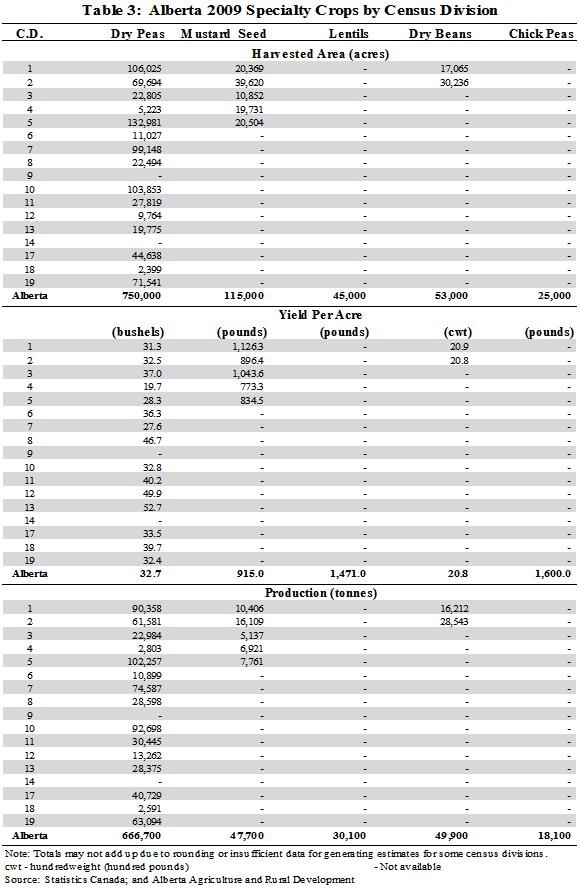
This section presents estimates of area, yield and production at the Census Division level in Alberta, for dry peas, mustard seed, and dry beans. Just to note, the Census Division estimates were generated from a small sample, and as such, caution should be exercised when interpreting and using the data. Also, for reference, the Alberta Census Division and municipality map is shown on page 5-Figure 4.
Dry peas
In 2010, the total seeded area of dry peas reached a new high at 935,000 acres (see Table 1), a 17 per cent increase from a year earlier. Of the total seeded area, a record 925,000 acres were harvested, up 23 per cent from 2009. Due to favorable crop growing conditions, the provincial average yield increased 19 per cent from 2009, to 39.0 bushels per acre and was 14 per cent above the 10-year average.
The total provincial production of dry peas reached a new record at 982,500 tonnes, up 47 per cent from the 2009 production of 666,700 tonnes. This was attributed to the higher yields and a larger harvested area.
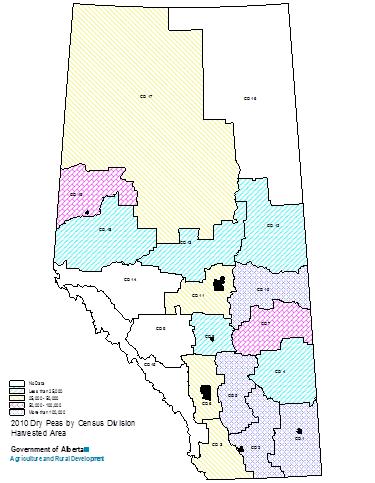
Although dry peas are grown primarily on dryland across the province, the largest acreages are in Census Divisions 5 (Drumheller area), 1 (Medicine Hat area), and 10 (Vegreville area) - see Table 2 and Figure 5. In 2010, these three Census Divisions (1, 5 and 10) accounted for 43 per cent of the provincial total harvested area. Just to note, dry pea yields were quite varied across the province.
Mustard seed
In 2010, Alberta producers seeded a total of 110,000 acres to mustard seed (see Table 1), down eight per cent from 2009. Harvested area decreased four per cent from the previous year to a total of 110,000 acres. The provincial average yield was estimated at a record 1,052.0 pounds per acre, 15 per cent higher than in 2009 and 35 per cent above the 10-year average.
The total provincial production of mustard seed was estimated at 52,500 tonnes, up 10 per cent from 2009. The production increase stemmed from the record yield.
Alberta produces three types of mustard seed - brown, yellow and oriental. Of the three types, yellow mustard seed continues to dominate, accounting for 78 per cent (40,900 tonnes) of the provincial total production in 2010. Brown mustard seed and oriental mustard seed represented 16 per cent (8,600 tonnes) and six per cent (3,000 tonnes), respectively.
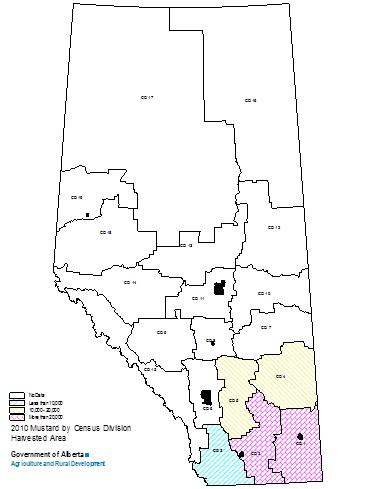
Mustard seed is mostly grown on dryland in southern Alberta. In 2010, nearly 65 per cent of the total harvested area in the province was in Census Divisions 1, 2 and 3 (see Table 2 and Figure 6). Mustard seed yields varied significantly across Census Divisions. For example, Census Division 5 had the highest yield of 1,431 pounds per acre, while the lowest yield of 1,135 pounds per acre was in Census Division 4.
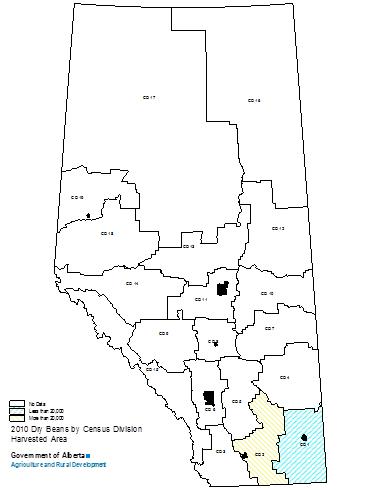
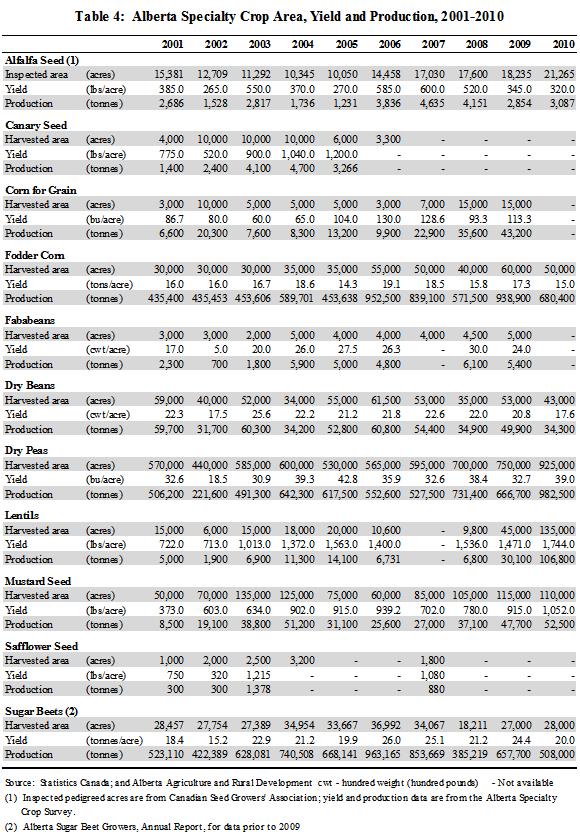
Dry beans
The total seeded area of dry beans in 2010 was estimated at 50,000 acres (see Table 1), down 10 per cent from 2009 . Of the total seeded area, 43,000 acres were harvested, down by 19 per cent from a year earlier. The provincial average yield was estimated at 1,760 pounds per acre, down 15 per cent from 2009, and 18 per cent below the 10-year average.
Total provincial production of dry beans in 2010 fell 31 per cent from 2009, to 34,300 tonnes. The lower production was attributed to the substantial decrease in harvested area and average yield.
Dry beans are grown mostly under irrigation in southern Alberta. In 2010, a total of 47,138 acres or 85 per cent of the provincial dry bean seeded area was irrigated, according to information from the Water Resources Branch of Alberta Agriculture and Rural Development.
Additionally, Census Divisions 1 and 2 collectively accounted for 94 per cent of the provincial total harvested area (see Table 2 and Figure 7). Dry beans are generally grown under contract in Alberta.
Exports of Alberta Specialty Crops
Dry Peas
In 2010, Alberta dry peas exports, at 97,402 tonnes, accounted for three per cent of total Canadian exports of 2.9 million tonnes. This was more than six times the 13,535 tonnes Alberta exported in 2009 (see Figure 8), but only one per cent below the 10-year average (2001 to 2010). In 2010, 62 per cent of Alberta dry peas exports (59,900 tonnes) were to Bangladesh, followed by India at 17,156 tonnes and China at 8,849 tonnes. Table 5 shows the top 10 destinations of Alberta’s dry peas exports.
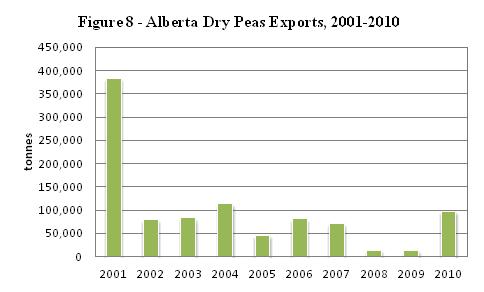
Source: Statistics Canada

Source: Statistics Canada
Mustard Seed
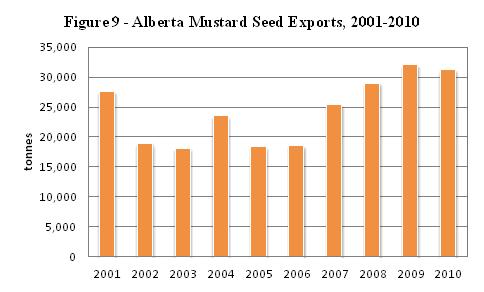
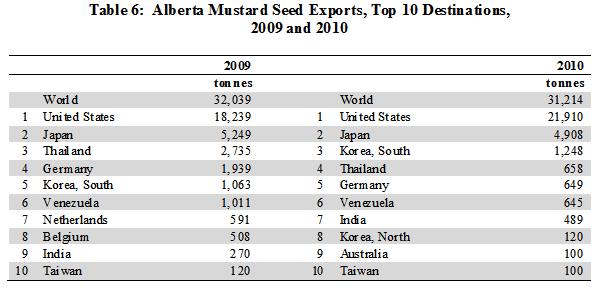
In 2010, Alberta mustard seed exports, at 31,214 tonnes, accounted for 24 per cent of total Canadian exports of 127,607 tonnes. This was down three per cent compared to 32,039 tonnes in 2009 (see Figure 9), but 29 per cent above the 10-year average. In 2010, Alberta exported 21,910 tonnes of mustard seeds to United States which represented 70 per cent of total Alberta exports to the world, followed by Japan with 4,908 tonnes, and South Korea with 1,248 tonnes. Table 6 shows the top 10 destinations of Alberta’s mustard seed exports.
Source: Statistics Canada
Source: Statistics Canada
Dry Beans
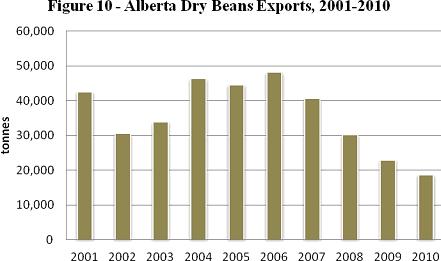
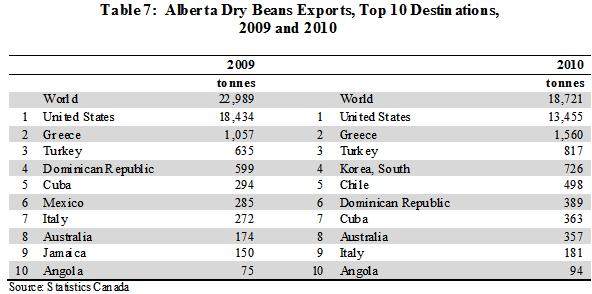
Alberta accounted for seven per cent of total Canadian dry beans exports (255,885 tonnes) in 2010. Alberta exported 18,721 tonnes of dry beans, down 19 per cent compared to 22,989 tonnes in 2009 (see Figure 10). Dry beans exports were 48 per cent below the 10-year average. In 2010, Alberta exported 13,455 tonnes of dry beans to United States which represented 72 per cent of total Alberta exports to the world, followed by Greece with 1,560 tonnes and Turkey with 817 tonnes. Table 7 shows the top 10 destinations of Alberta’s dry beans exports.
Source: Statistics Canada
Markets for Selected Specialty Crops
By: Charlie Pearson
Field Peas
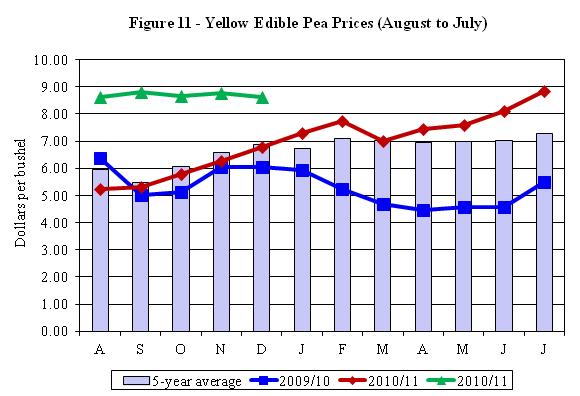
Yellow edible pea prices have held in the $8.50 to $9.00 per bushel range over the past fall, above the $6 to $8 per bushel range a year ago. Both green and yellow edible pea prices are expected to remain historically high over the coming winter (see Figure 11).
Canadian field pea production in 2011 was estimated to be about 2.1 million tonnes, down 30 per cent from 3.0 million tonnes in 2010. A smaller crop will limit Canada’s ability to export field peas in the coming years, particularly in the last half of the crop year. Canadian pea exports during the 2011/12 crop year are forecast to be about two million tonnes, down over one-third from the three million tonnes exported in 2010/11.
Source: Alberta Agriculture and Rural Development
Lentils
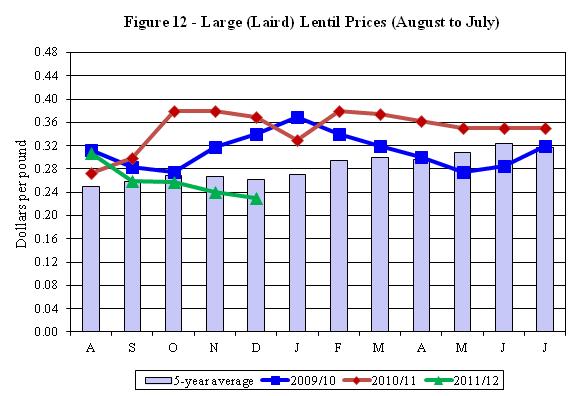
Large seeded green lentils (Laird types) have declined into the 23 to 24 cent per pound range, well under the 35 to 38 cent per pound range over the past crop year (see Figure 12). Western Canadian lentil production in 2011 is estimated to be 1.5 million tonnes, down 25 per cent from 2 million tonnes in 2010.
July 31, 2011 carryovers were a record 750,000 tonnes, double the level of the previous year. The large carryover from the past crop has been more than enough to offset the decline in production resulting in total available lentil supplies in 2011/12 that are actually higher than the previous crop year. The large available supplies are the major factor depressing lentil prices.
Source: Alberta Agriculture and Rural Development
Chick peas
Kabuli chick pea prices have mostly held in the 50 to 54 cent per pound range over the past fall, well above the above the 5 year average (see Figure 13). Western Canadian chick pea production in 2011 was estimated to be 91,000 tonnes, down almost 30 per cent from 2010. Tighter supplies will limit exports to the premium price markets. This applies particularly to large seeded kabuli varieties
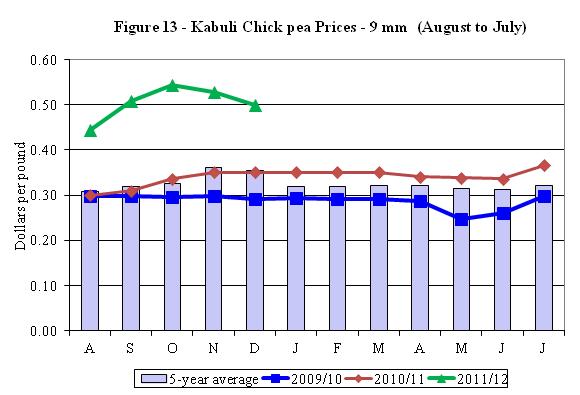
Source: Alberta Agriculture and Rural Development
Canary Seed
Western Canadian canary seed prices rallied into the 25 to 27 cent per pound range this past fall, up from a year ago and well above the 5 year average (see Figure 14). Canadian canary seed production in 2011 is estimated to be 102,000 tonnes, down 34 per cent from 2010. Tight Canadian canary seed supplies will support historically high prices for the remainder of the crop.
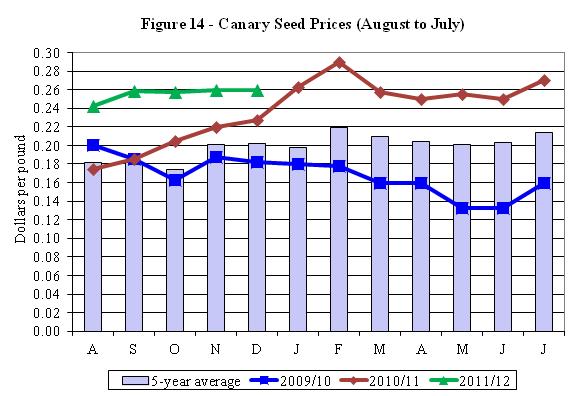
Source: Alberta Agriculture and Rural Development
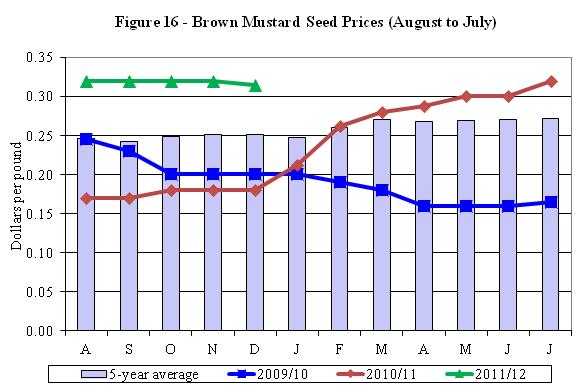
Mustard Seed
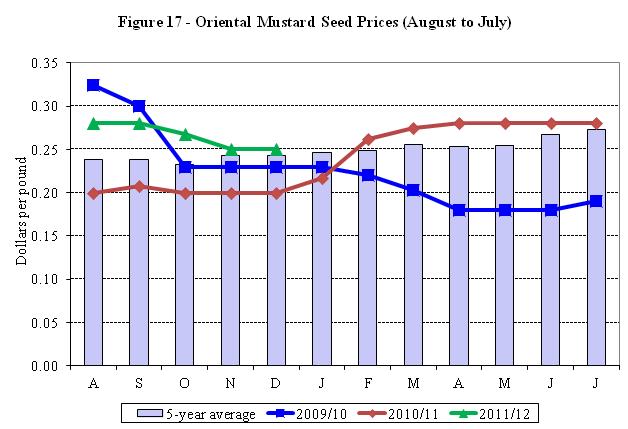
Figure 15 and 16 shows that brown and yellow mustard prices have held at around 32 and 35 cent per pound respectively this past fall, above the levels of the previous years and the 5 year average. Oriental mustard prices have been around the 25 to 28 cent per pound range, closer to a five year average (see Figure 17). Western Canadian mustard production in 2011 is estimated by Statistics Canada to be 125,000 tonnes, down 33 per cent from 2010. The large carryover from the 2010/11 crop year, however, is largely offsetting the smaller production level with total available supplies in 2011/12 only down six per cent from 2010/11.
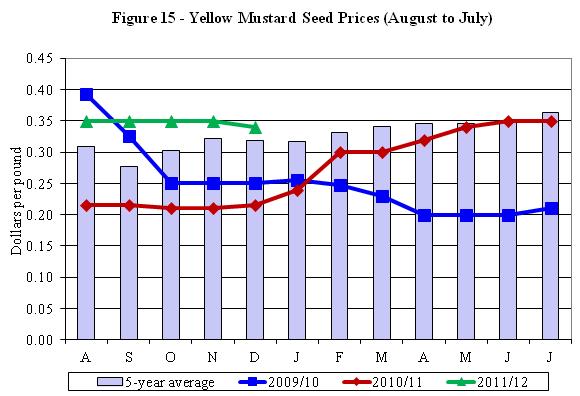
Source: Alberta Agriculture and Rural Development
Source: Alberta Agriculture and Rural Development
Source: Alberta Agriculture and Rural Development
Economics of Specialty Crop Production
by Nabi Chaudhary
Costs and returns for crops, livestock, and several other enterprises have been monitored in the province in an extensive way since the 1960’s. These studies have been viewed as an important tool for assisting producers in their cropping decisions and the federal and provincial governments in developing policies and programs for different farm enterprises. In addition, results from these studies have served to fill some data gaps for other provinces.
The Economics Section (formerly known as Production Economics Section) in the Economics and Competitiveness Branch of Alberta Agriculture and Forestry, has been conducting economic studies on various farm enterprises for the last several decades. Since the early 1990’s, much greater emphasis has been placed on developing costs and returns data on specialty crops for farm diversification purposes.
Continued volatile markets for traditional cereals and oilseeds have forced producers to diversify their operations into new and emerging specialty crops. As mentioned above, results from these studies have been very helpful to primary producers when making cropping decisions. Furthermore, individual producers have also used the results from these studies to compare costs and returns and profitability margins of their farms with the group averages from the respective areas in order to develop better management practices. Agri-businesses and other stakeholders have used the results of the economic studies for feasibility studies.
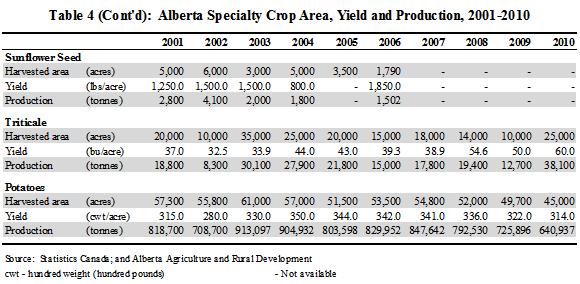
During the last ten years, area under special crops has increased significantly in Alberta. The total seeded area of dry field peas was 385,000 acres in 1997, and jumped to 610,000 acres in 2001. In 2002, seeded area increased seven per cent to 650,000 acres. However, seeded area declined to 600,000 acres in 2003. In 2004, seeded area was estimated at 640,000 acres, an increase of about seven per cent over 2003. The seeded area in 2005 decreased 13 per cent, to 555,000 acres. In 2006, seeded area for dry peas increased six per cent, to 587,263 acres. Total harvested area in 2006 was 565,000 acres, or 96 per cent of the seeded area. Provincial average yield for the 2006 dry peas crop was 35.9 bushels per acre. Seeded area to dry peas increased by about four per cent over in 2006 to 610,000 acres in 2007. Seeded area increased by 100,000 acres in 2008 from the previous year. Seeded area to dry peas was almost 800,000 acres in 2009, a whopping increase of 190,000 acres over in 2008. In 2010, seeded area for dry field peas was estimated at 910,000 acres, an increase of almost 14 per cent over the area in 2009. Average provincial yield for the 2009 dry peas was estimated at 32.7 bushels per acre, almost six bushels lower than in 2008. Yield for the 2010 dry peas crop was about six bushels per acre more at 38.5 bushels than the previous year crop.
Dry beans acreage in Alberta has fluctuated over the last decade. The total seeded area was 60,000 acres in 2001, and remained unchanged in 2002. It decreased about 13 per cent, to 52,000 acres in 2003. The acreage continued to decline, and totaled 35,000 acres in 2004. In 2005, the total seeded area was estimated at 57,000 acres, an increase of almost 63 per cent over 2004. The acreage in 2006 jumped to 62,039 acres, or nine per cent higher than in 2005. Of the total seeded area in 2006, about 61,500 acres were harvested, with an average yield of 2,180 pounds per acre. In 2007, area seeded to dry beans decreased quite significantly by about 15 per cent to 52,900 acres. Area seeded to dry coloured beans in 2008 further decreased by over 24 per cent to 40,000 acres. In 2009 area seeded to dry beans increased to 55,000 acres, an increase of almost 38 per cent over in 2008. However, area seeded to dry beans in 2010 decreased by 5,000 acres to 50,000 acres, a decrease of about nine (9) per cent over in 2009. Harvested area for the 2010 dry beans crop was only 43,000 acres due to poor weather conditions. Average yield for the 2009 dry beans crop was estimated at 2,400 pounds per acre, around 200 pounds more than in 2008. Yield for the 2010 dry bean crop was estimated at 1,760 pounds per acre which showed a significant decrease (640 pounds) over the yield in 2009. Please note most of the dry beans are grown under contract on irrigated land in southern Alberta.
In the late 1990’s, producers showed considerable interest in chick peas (known as the new Cinderella crop on the Prairies). Chick peas were a huge crop in Saskatchewan from 1999 to 2001, occupying almost one million acres. In Alberta, acreage under chick peas was 100,000 acres in 2001, double the acreage in 2000. However, the area under chick peas decreased drastically to 45,000 acre in 2002, primarily due to drought concerns and disease problems. In 2003, the acreage dropped to 25,000 acres. The decline in area continued in 2004, with a total of 15,000 acres, the lowest area on record. In 2005, the total seeded area doubled, to 30,000 acres. In 2006, it increased about 37 per cent to 40,749 acres. Of this total seeded, 40,000 acres were harvested, with an average yield of 1,433 pounds per acre. In 2007, area seeded to chick peas (Kabuli and Desi) increased to almost 50,000 acres, i.e., by almost 23 per cent over in 2006. In 2008 area planted to chick peas decreased considerably as Statistics Canada had only a few producers to report. Therefore no actual area figure was published for 2008 as the number of producers reporting on seeding chick peas was quite small. However, in 2009 area under chick peas (both desi and kabuli) was estimated at 25,000 acres. Average yield for the 2009 chick peas crop was estimated around 1,600 pounds per acre. The changes in chick pea acreage over the last decade could be attributed to drought concerns, crop diseases, and production of major importing countries. It is estimated that area under chick peas (desi and kabuli) more or less remained at the same level as in 2009. Estimated yield for both varieties of chick peas in 2010 was lower than the previous year.
Additionally, producer interest in other specialty crops, including caraway, buckwheat, coriander, borage, herbs and spices, continues to grow.
Tables 9, 10 and 11 present estimates of 2010 production costs and returns for dry field peas; dry beans and chick peas (desi and kabuli), respectively. Readers are cautioned to use these costs as guidelines because costs and returns could vary significantly from one operation to another.
Table 9: Production Costs and Returns for Dry Peas |
Dark Brown Soil Zone, 2010 |
 | $ Per acre | $ Per bus. |
| Revenue per Acre |
| Yield per Acre (bushels) | 38.5 | |
| Expected Market Price/Bushel ($) | 5.45 | |
| (a) Gross Revenue per Acre | 209.83 | 5.45 |
|
| Costs per Acre ($) |
| Seed and Seed Cleaning | 26.57 | 0.69 |
| Fertilizer Rates: 2N 16P 1K 3S | 13.34 | 0.35 |
| Chemicals | 28.60 | 0.74 |
| Hail/Crop Insurance Premiums | 13.06 | 0.34 |
| Trucking and Marketing | 4.05 | 0.11 |
| Fuel | 10.08 | 0.26 |
| Repairs - Machinery & Buildings | 7.41 | 0.19 |
| Utilities & Miscellaneous Expenses | 6.02 | 0.16 |
| Custom Work & Labour | 8.17 | 0.21 |
| Operating Interest Paid | 4.18 | 0.11 |
| Unpaid Labour | 13.01 | 0.34 |
| (b) Variable Costs | 134.48 | 3.49 |
|
| Taxes, License & Insurance | 11.28 | 0.29 |
| Equipment & Building - Depreciation | 18.76 | 0.49 |
| Paid Capital Interest | 4.83 | 0.13 |
| (c) Capital Costs | 34.87 | 0.91 |
|
| (d) Total Production Costs (b+c) | 169.35 | 4.40 |
|
| Gross Margin | 46.23 | 1.20 |
| Return to Investment (a-d+capital interest) | 45.31 | 1.13 |
| Return to Equity (a-d) | 40.48 | 1.05 |
Note: Returns per acre may vary with yield and price.
Source: Alberta Agriculture and Rural Development
For more information contact:
Emmanuel Laate 780-422-4054
Table 10: Production Costs and Returns for Dry Beans |
Dark Brown Soil Zone, 2010 |
| $ Per acre | $ Per pound |
| Revenue per Acre |
| Yield per Acre (lbs) | 1,760 | |
| Expected Market Price/Pound ($) | 0.28 | |
| (a) Gross Revenue per Acre | 492.80 | 0.28 |
|
| Costs per Acre ($) |
| Seed and Seed Cleaning | 28.29 | 0.02 |
| Fertilizer Rates: 2N 16P 1K 3S | 82.81 | 0.05 |
| Chemicals | 78.49 | 0.04 |
| Hail/Crop Insurance Premiums | 32.06 | 0.02 |
| Trucking and Marketing | 13.43 | 0.01 |
| Fuel | 51.77 | 0.03 |
| Repairs - Machinery & Buildings | 50.24 | 0.02 |
| Utilities & Miscellaneous Expenses | 19.89 | 0.01 |
| Custom Work & Labour | 12.92 | 0.01 |
| Operating Interest Paid | 11.92 | 0.01 |
| Unpaid Labour | 96.01 | 0.05 |
| (b) Variable Costs | 477.83 | 0.27 |
|
| Cash/Crop Share Rent | 0.00 | 0.00 |
| Taxes, License & Insurance | 33.23 | 0.02 |
| Equipment & Building - Depreciation | 67.80 | 0.03 |
| Paid Capital Interest | 10.74 | 0.01 |
| (c) Capital Costs | 111.77 | 0.06 |
| | |
| (d) Total Production Costs (b+c) | 589.60 | 0.33 |
|
| Gross Margin | 9.95 | 0.01 |
| Return to Investment (a-d+capital interest) | -86.01 | -0.05 |
| Return to Equity (a-d) | -96.80 | -0.05 |
Note: Returns per acre may vary with yield and price.
Source: Alberta Agriculture and Rural Development
For more information contact:
Emmanuel Laate 780-422-4054
Table 11: Production Costs and Returns Desi and Kabuli |
Chick Peas, 2010 |
| Desi
Chick Peas | Kabuli
Chick Peas |
| Revenue per Acre |
| Estimated Yield per Acre (lbs) | 1,495 | 1,550 |
| Price per Pound ($) | 0.25 | 0.27 |
| (a) Gross Revenue per Acre ($) | 373.75 | 418.50 |
|
| Costs per Acre ($) |
| Variable Costs per Acre | | |
| Seed | 21.71 | 49.93 |
| Fertilizer | 8.89 | 9.66 |
| Chemicals | 14.68 | 18.64 |
| Machinery Expenses (Fuel & Repair) | 19.18 | 22.05 |
| Custom Work & Hired Labour | 6.08 | 7.35 |
| Utilities & Miscellaneous | 8.86 | 9.51 |
| Interest on Variable Expenses | 2.47 | 3.28 |
| (b) Total Variable Costs | 81.88 | 120.43 |
| Other Costs per Acre | | |
| Building Repair | 2.98 | 2.98 |
| Property Expenses, Insurance & License | 7.99 | 7.99 |
| Machinery & Building Depreciation | 23.55 | 23.55 |
| Machinery & Building Investment | 13.55 | 13.55 |
| Labour & Management | 17.90 | 20.77 |
| (c) Total Other Costs | 65.97 | 68.65 |
| (d) Total Production Cost (b+c) | 147.86 | 189.07 |
| Return per Acre ($) | | |
| Return Over Variable Expenses (a-b) | 291.87 | 298.07 |
| Return Over Total Production Costs (a-d) | 225.89 | 229.43 |
Note: Returns per acre may vary with yield and price.
Source: Alberta Agriculture and Rural Development
For more information contact:
Emmanuel Laate 780-422-4054
Acknowledgment
The Statistics and Data Development Branch of Alberta Agriculture and Rural Development (ARD) wishes to thank all of the producers who participated in the Alberta 2010 Specialty Crop Survey conducted in the winter of 2010/2011. Without their cooperation and assistance, this report would not have been possible.
Several ARD staff members have made significant contributions to the successful completion and dissemination of this report. Those staff include Charlie Pearson of Competitiveness and Market Analysis Branch, Nabi Chaudhary of Economics Branch, Reynold Jaipaul, Roy Larsen, Melodie Mynzak, Marion Harry, Guangzhi Liu, Gail Atkinson, Ann Stankiewicz and Marian Elson of Statistics and Data Development Branch.
Lukas Matejovsky
Crop Statistician
Alberta Agriculture and Forestry
Economics and Competitiveness Branch
Statistics and Data Development Section
#302, 7000 -113 Street
Edmonton, Alberta T6H 5T6
Phone: 780-422-2887
Fax: 780-427-5220Contacts
For additional information relating to the various sections of this report, please do not hesitate to contact the subject area specialist referenced under each section.
For additional copies of this report, please contact:
Alberta Agriculture and Forestry
Economics and Competitiveness Branch
Statistics and Data Development Section
#300, 7000 -113 Street
Edmonton, Alberta T6H 5T6
Phone: 780-422-2887
Fax: 780-427-5220
ISSN 1701-3143 (Print)
ISSN 1927-7830 (Online)
ISBN 978-0-7732-6090-0 (Print)
ISBN 978-0-7732-6091-7 (Online)
Full report in pdf file |
|