| | Nutrient requirements of crops | Nutrient uptake and accumulation | Soil sampling | Deficiency symptoms and plant tissue analysis | Determining fertilizer requirements | Fertilizer application | Rate, placement and time of fertilizer applications | Fertigation | Computerized fertilizer recommendations | Summary | Appendix: Fertilizer response tables
Soil fertility and fertilizer management are important aspects of irrigated crop production. High yielding irrigated crops take up considerable amounts of various nutrients from soil. To achieve optimum crop yields, producers need to ensure plants have an adequate nutrient supply in their soils.
Soil tests are very useful to assess the soil nutrient status, allowing for the development of an economical and environmentally responsible soil fertility program for irrigated crop production. Producers need to understand how the amounts and availability of soil nutrients can limit crop growth before management practices can be developed to improve crop production.
This Agdex factsheet contains fertilizer management information and recommendations for irrigated grain and oilseed crops based on recent field research conducted by the Agronomy Section of Alberta Agriculture and Rural Development. See the topic list below.
Topic List
- Nutrient requirements of crops
- Nutrient uptake and accumulation
- Soil sampling
- Deficiency symptoms and plant tissue analysis
- Determining fertilizer requirements
- Fertilizer application
- Rate placement and time of fertilizer application
- Fertigation
- Computerized fertilizer recommendations
- Appendix: Fertilizer response tables
Nutrient Requirements of Crops
Cereal and oilseed crops need 16 nutrients to grow properly. Nutrients needed in larger amounts are called macronutrients. Nutrients required in smaller amounts are known as micronutrients.
Macronutrients: Plants need carbon (C), hydrogen (H) and oxygen (O), which typically come from carbon dioxide in the atmosphere and water taken up from the soil. The macronutrients that come from soil include nitrogen (N), phosphorus (P), potassium (K), sulphur (S), calcium (Ca) and magnesium (Mg). In Alberta, nitrogen and phosphorus often are the two most limiting nutrients for irrigated crop production. K and S are occasionally limiting, while Ca and Mg have not been found to limit crop growth in Alberta.
Micronutrients: The micronutrients, also called trace elements, include chlorine (Cl), boron (B), iron (Fe), manganese (Mn), zinc (Zn), copper (Cu) and molybdenum (Mo). Generally, these elements do not limit growth on most soils and crop conditions in Alberta. On irrigated land in southern Alberta, micronutrient fertilizer research has not identified irrigated grain or oilseed deficiencies. However, Zn deficiencies have been identified with irrigated dry beans, primarily grown on sandy soils. Producers are cautioned to use great care if using micronutrient fertilizers and not over-fertilize because the range between deficient and toxic levels of some micronutrients is narrow.
The approximate nutrient levels removed by spring wheat, barley, canola and flax are provided in Table 1. The amount of each nutrient removed varies with several factors: crop cultivar, environmental conditions during the growing season, the amount of nutrient available in the soil and the yield potential of the crop. Crops may take up some elements in greater quantities than required (referred to as luxury consumption) when there is an over-abundance of the element in the soil. To achieve optimum crop yields, plants must have access to optimum amounts of nutrient elements either from the soil or from applied fertilizer.
| Table 1. Approximate amount of nutrients removed by four irrigated crops. Removal can vary by up to 20 per cent depending on variety and environmental conditions. |
| Crop | Crop
Part | Nitrogen (N) | Phosphate (PO) | Potassium (KO) | Sulphur (S) | Chlorine (Cl) | Boron (B) | Copper (Cu) | Iron (Fe) | Manganese (Mn) | Zinc (Zn) |
lb/acre |
 | Seed | 145 | 55 | 35 | 10 | 7 | .07 | <.l | .50 | .20 | .20 |
| Straw | 55 | 15 | 120 | 14 | 2 | .02 | <.l | .20 | .30 | <.10 |
| Total | 200 | 70 | 155 | 24 | 9 | .09 | <.2 | .70 | .50 | <.30 |
| Seed | 145 | 50 | 45 | 12 | 9 | .10 | <.l | .30 | .10 | .10 |
| Straw | 65 | 15 | 135 | 14 | 1 | .02 | <.l | .10 | .70 | .10 |
| Total | 210 | 65 | 180 | 26 | 10 | .12 | <.2 | .40 | .80 | .20 |
| Seed | 160 | 60 | 30 | 20 | | | | | | |
| Straw | 65 | 20 | 120 | 15 | | | | | | |
| Total | 225 | 80 | 150 | 35 | | | | | | |
| Seed | 150 | 45 | 35 | 13 | | | | | | |
| Straw | 45 | 10 | 100 | 17 | | | | | | |
| Total | 195 | 55 | 135 | 30 | | | | | | |
.
Nutrient Uptake and Accumulation
In many crops, the majority of the N, P, S and Mo taken up by plants is found in the seed, while stalks and leaves contain the majority of the K, Ca, Mg, Zn, Fe, Mn, B and Cu. During early plant growth for most cereal and oilseeds, nutrient uptake is greater than growth. For example, when a crop reaches 40 per cent of its final dry weight, 60 to 75 per cent of the total N, P and K have accumulated within the plant.
Plants take up nitrogen continuously. As plants shift from vegetative to reproductive growth, they translocate N from the older to the newer leaves, then to stems and developing seed. By maturity, the seed will contain 60 to 75 per cent of the N taken up by the plant, depending on crop type and environmental conditions.
Phosphorus is also taken up continuously during the growing season. However, often within 40 days of emergence, grain crops can take up as much as 70 per cent of their P requirement. Much of the P accumulated by the leaves and stems is translocated to the grain by crop maturity.
Uptake of K begins when rapid vegetative growth starts and continues until grain starts forming, at which time the uptake of K is nearly complete. Unlike N and P, the majority of the K in the plant is found in the leaves and stems, not in the seed.
Irrigated crops grown on nutrient-deficient soils can only reach optimum yields with the application of appropriate types and rates of fertilizer. Optimum fertilization may not increase crop yields or quality to optimum if other management inputs are not at optimum levels.
Irrigation producers must ensure that good crop rotation management practices are employed:
- selection of the best crop varieties
- crops are seeded at the optimum time and rate (see Agdex 100/561-2, Optimum Seeding Date and Rates for Irrigated Grain and Oilseed Crops)
- weeds, insects and diseases are controlled
- excellent irrigation water management is practiced
Ideally, an excellent fertilizer program should be based on soil tests to determine the nutrient status of the soil, along with knowledge of the nutrient requirements of the crops to be grown, target yield, previous cropping history, fertilizer prices, estimated value of the crop at harvest and the management level of the producer.
Soil Sampling
Soil tests are very useful to determine the type and amount of fertilizers needed to ensure optimum nutrient levels for irrigated crop production. On uniform fields, soil samples can be taken randomly at 15 to 20 locations in each field. Sample large fields (over 160 acres) separately. Unusual soil areas should be sampled separately as well (machine levelled, eroded, saline or low relief areas) or else avoided completely.
Divide each soil core into 0 to 6, 6 to 12 and 12 to 24 inch depths (0 - 15, 15 - 30 and 30 - 60 cm). Samples should be shipped in a cooler for overnight delivery to a soil testing lab. If samples cannot be shipped the same day they are taken, then samples must be air dried before they are sent to a soil testing laboratory for analysis. Contact a soil specialist for detailed information on soil sampling and handling.
Deficiency Symptoms and Plant Tissue Analysis
Visual deficiency symptoms
Some nutrient deficiencies have characteristic symptoms. However, it is very important to note that visual crop symptoms cannot be relied upon alone to identify a nutrient problem because a symptom may signal the presence of other problems such as restricted root growth or disease. But visual symptoms are helpful when used along with other diagnostic tools to identify crop growth problems. Producers can then proceed with a more detailed investigation. Unfortunately, by the time visual symptoms of a nutrient deficiency appear, significant yield losses have already occurred.
Nitrogen: Nitrogen is readily transferred from older to newer leaves as soil nitrogen is depleted. As an N deficiency develops, older leaves appear light green to pale yellow, while younger leaves are a darker green.
Phosphorus: A P deficiency is more noticeable in young plants, which have a high demand for this nutrient. If the deficiency is slight to moderate, the only visual symptom may be slightly stunted growth, which can be confused with other crop problems. Phosphorus is readily transferred from older to younger leaves. Very severe deficiency may cause a slight purplish colour on stems, and dark yellow tips on older leaves may indicate symptoms, but this appearance can be a sign of other induced stresses. Purple-coloured stem or leaf edges cannot be used as an accurate indicator of phosphorus deficiency, particularly in canola, as a number of different stress factors can also cause these symptoms.
Potassium: Potassium is readily transferred from older to younger leaves when a deficiency occurs. Slight deficiency will cause slightly stunted crop growth. Severe deficiency will cause yellowing, first on the tips of older leaves, which then advances toward the base of the leaf. Younger leaves usually remain a darker green. Potassium deficiency can be very difficult to diagnose based on visual symptoms.
Sulphur: Leaves of both S and N deficient plants appear light green or pale yellow. However, S does not move readily from older to younger leaves. In the early stages of a severe S deficiency, younger leaves first appear light green or pale yellow, while older leaves remain green. The opposite occurs with an N deficiency.
Canola yields may be reduced even if the sulphur deficiency is slight and there are no obvious visual symptoms. Sulphur deficiency causes new or younger leaves to be yellow in the initial stages and eventually affects all leaves. In some cases, leaves are poorly developed and cupped, and the backs of leaves may even be purplish. The flowers may be paler yellow than normal.
Sulphur deficiency delays and prolongs flowering and delays maturity. Pods form more slowly, are small and poorly filled. The seeds are shrunken or shrivelled. If S deficiency symptoms are noticeable in canola, S is severely lacking.
Micronutrient deficiencies rarely occur on irrigated land with cereal and oilseed crops in Alberta. Below are brief general descriptions of more severe micronutrient deficiencies. However, if slight to moderate deficiency of a micronutrient does occur, symptoms may be slight or not noticeable.
Boron: Boron deficiency would most likely be observed with canola grown on a sandy, intensively cropped soil. A severe boron deficiency results in very stunted growth of young plants. The youngest leaves are affected first. They are deformed, thick, brittle and small because B is not easily transferred from older to younger leaves. Older leaves usually remain green and appear healthy. Often, dark brown, irregular lesions may appear, followed by pale yellow chlorosis of young leaves. Stems are short and growing points may die. In canola, symptoms of a B deficiency can easily be confused with S deficiency.
Chlorine: Chlorine deficiencies are very rare and have not been observed in Alberta. Symptoms of a deficiency may include stubby roots, some chlorosis of new leaves and plant wilting. Research in the northern United States has shown that chloride added at rates higher than required to meet nutritional needs is associated with suppression of root and leaf diseases in some cereal crops. This result has not been observed in research trials in southern Alberta.
Copper: Copper deficiency would most likely be observed with cereal crops grown on a sandy, intensively cropped soil. Copper is not readily transferred from older to younger leaves. When a deficiency occurs, older leaves remain darker and relatively healthy, with symptoms developing on younger leaves. In wheat, Cu deficiency symptoms include yellowing of younger leaves, limpness, wilting, pigtailing of the upper leaves, kinking of the leaf tips, excessive tillering, aborted heads, delayed maturity and poor grain filling. Copper deficiency can also resemble frost damage. On Cu deficient soils, these symptoms tend to occur in irregular patches.
Copper deficiency is often associated with the disease stem or head melanosis and an increased incidence of ergot. For barley, symptoms include yellowing, pigtailing, awn kinking, excessive tillering and weak straw. Copper deficiency symptoms are poorly documented for canola but may include stunted plants, slow pod development, reduced seed set and increased amounts of green seeds.
Iron: An Fe deficiency is characterized by chlorosis of younger leaves. The tissue between the veins gradually turns yellow, while the veins tend to stay green. The tips and margins of some leaves may turn brown and become dry and brittle.
Manganese: The micronutrient manganese is not readily transferred from older to younger leaves in wheat and barley. In wheat and barley, affected leaves turn pale green and appear limp or wilted. Leaves develop a rapidly spreading interveinal chlorosis in the mid-section. Small white to grey spots, specks or stripes could appear near the end of the leaf tip on young leaves, and leaves may have a limp or wilted appearance.
Zinc: Zinc deficiency is most likely to occur on sandy, intensively cropped soils as well as soils that have been wind eroded or machine leveled and subsoil has been exposed. Zinc is partly mobile in wheat and barley. Severe deficiency symptoms appear in these crops as pale yellow chlorotic areas on middle leaves, halfway up the stem. Chlorosis may develop on the lower half or mid-section of the leaf followed by grey or dark brown necrosis of the leaf. Generally, stems are shorter with leaves crowded together. In flax, deficiency can cause greyish-brown spots in the younger leaves, shortened internodes and a stunted appearance.
Tissue sampling and testing
Plant tissue tests may be somewhat helpful for determining which nutrients are potentially responsible for poor crop growth and may assist with choosing a fertilizer program to correct a problem. Tests involving plant tissue must be calibrated with field fertilizer trials.
Calibration of tissue tests is complex because the measured nutrient concentration, which is the basis of the tests, varies with the stage of plant development, environmental conditions, crop variety and the portion of the plant sampled. Very little plant tissue research has been conducted with irrigated grain and oilseed crops in Alberta.
Producers can take representative plant tissue samples early in the growing season to assist with the interpretation of soil tests. Take plant tissue samples from both a normal crop growth area and the poor growth area in a field to ensure a useful comparison between affected and unaffected areas.
For small grain crops, sample all the aboveground plant portion before heading. For flax and canola, sample all aboveground plant portions before or during early flowering. Normally, a sample of 25 plants from a field is sufficient for a tissue analysis.
Be very careful not to contaminate plant tissue samples with soil. Samples must be completely free of soil. Do not include root material with tissue samples. Place clean, fresh samples in clean paper bags and air dry them to remove excess moisture before shipment to a laboratory.
For most crops, the concentration of nutrient elements found in plant parts can be used to assist in determining the nutritional status of the plant. The quality of the analysis depends on the sampling procedure and the interpretation of the results.
Table 2 provides general nutrient values in tissue of cereals, canola and flax. For more specific range values for various crops, as well as interpretation of test results, contact a soil and crop specialist.
| Table 2. Generalized levels of nutrients in plant tissue of small grains, canola and flax. |
| Cereals, whole plant prior to filling | Low | Marginal | Sufficient |
| Per cent (%) |
| Nitrogen | <1.5 | 1.5 - 2.0 | >2.0 |
| Phosphorus | <0.15 | 0.15 - 0.25 | >0.25 |
| Potassium | <1.0 | 1.0 - 1.5 | >1.5 |
| Sulphur | <0.1 | 0.1 - 0.15 | >0.15 |
| Parts per million (ppm) |
| Boron | <3.0 | 3.0 - 5.0 | >5.0 |
| Copper - barley | <2.3 | 2.3 - 3.7 | >3.7 |
| - wheat | <3.0 | 3.0 - 4.5 | >4.5 |
| - oats | <1.7 | 1.7 - 2.5 | >2.5 |
| Iron | <15.0 | 15.0 - 20.0 | >20.0 |
| Manganese | <10.0 | 10.0 - 15.0 | >15.0 |
| Molybdenum | <.01 | 0.01 - 0.02 | >0.02 |
| Zinc | >10.0 | 10.0 - 15.0 | >15.0 |
|
| Canola at early flowering | Low | Marginal | Sufficient |
| Per cent (%) |
| Nitrogen | <2.0 | 2.0 - 2.5 | >2.5 |
| Phosphorus | <0.15 | 0.15 - 0.25 | >0.25 |
| Potassium | <1.2 | 1.2 - 1.5 | >1.5 |
| Sulphur | <0.20 | 0.20 - 0.25 | >0.25 |
| Parts per million (ppm) |
| Boron | <20.0 | 20.0 - 30.0 | >30.0 |
| Copper | <1.7 | 1.7 - 2.7 | >2.7 |
| Parts per million (ppm) |
| Iron | <15.0 | 15.0 - 20.0 | >20.0 |
| Manganese | <10.0 | 10.0 - 15.0 | >15.0 |
| Molybdenum | - | - | - |
| Zinc | <12.0 | 20.0 - 30.0 | >30.0 |
|
| Flax at early flowering | Low | Marginal | Sufficient |
| Per cent (%) |
| Nitrogen | <1.25 | 1.25 - 1.75 | >1.75 |
| Phosphorus | <0.2 | 0.2 - 0.25 | >0.25 |
| Potassium | <1.0 | 1.0 - 1.5 | >1.5 |
| Sulphur | <0.1 | 0.1 - 0.15 | >0.15 |
| Parts per million (ppm) |
| Boron | <3.0 | 3.0 - 5.0 | >5.0 |
| Copper | <2.4 | 2.4 - 3.5 | >3.5 |
| Iron | <15.0 | 15.0 - 20.0 | >20.0 |
| Manganese | <10.0 | 10.0 - 20.0 | >20.0 |
| Molybdenum | – | – | – |
| Zinc | <12.0 | 12.0 - 15.0 | >15.0 |
Note: Critical levels have not been established for chlorine.
Source: Alberta Agriculture and Rural Development.
Determining Fertilizer Requirements
Nitrogen (N)
All cereal and oilseed crops require nitrogen in relatively large amounts (see Table 1). Nitrogen is often the most limiting nutrient in irrigated cereal and oilseed production in Alberta. Crops normally take up most of their N from the soil in the form of nitrate nitrogen NO3-N). When soil N levels are adequate, N promotes vigorous growth and a larger leaf area with a dark green colour.
Soil testing and analysis are very useful to estimate the nitrogen fertilizer requirement. Table 3 provides a generalized rating for various soil test nitrate nitrogen levels in the 0 to 24 inch (0 - 60 cm) depth for irrigated cereal and oilseed crop production.
| Table 3. Generalized soil test interpretation of range for nitrate nitrogen in the 0 to 24 inch (0 - 60 cm) depth of soil for irrigated cereal and oilseed crops. |
Soil test nitrate-N in lb/ac
(0 - 24 inches) | Rating |
| 0 - 20 | Extremely deficient |
| 20 - 40 | Very deficient |
| 40 - 70 | Deficient |
| 70 - 100 | Marginal |
| 100 - 150 | Adequate |
| 150 - 200 | High |
| >200 | Very high |
Crops obtain nitrogen from the following sources:
- inorganic nitrate nitrogen (NO3-N) and ammonium nitrogen (NH4+-N) in the soil solution
- ammonium and nitrate nitrogen released from breakdown of soil organic matter, manure or residual N from legume crops during the growing season
- applied nitrogen fertilizer (NH4+-N and NO3-N)
- from rainfall associated with lightning (this in usually only a very small amount of <10 lb N/ac/year)
Almost all N stored in the soil is found in soil organic matter. One per cent of organic matter represents about 1,000 pounds of N per acre. Reduced tillage on irrigated land in southern Alberta results in gradually increased soil organic matter levels. This practice has resulted in an increased potential for N release from soil organic matter.
Generally, about 1 to 2 per cent of the N tied up in organic matter is released each year. Therefore, a soil with 4 per cent organic matter will typically release 40 to 80 lb per acre of available N each growing season.
Soil micro-organisms are responsible for releasing (mineralizing) N contained in soil organic matter. Several factors influence the activity of these micro-organisms: environmental conditions (soil temperature and soil moisture), organic matter content and plant residue (particularly the carbon-to-nitrogen ratio in plant residue).
Recent research has shown that about 15 to 40 per cent of the total N required for high crop yields is supplied by N released from soil organic matter mineralization on irrigated fields in southern Alberta. Fertilizer must supply the remaining N. If the previous crop was a legume, approximately 10 to 30 lb/ac of available N is added to soil from plant residue. The amount of N fertilizer required depends on the level of soil nitrate-nitrogen NO3-N). Less fertilizer will be needed if the level of plant-available soil nitrogen is higher.
Crops respond dramatically to N fertilizer on deficient soils. Under irrigation, high rates of N fertilizer can be economical, but they should only be applied when soil test levels of nitrate-nitrogen are very low.
Fertilizer recommendation tables have been developed under field conditions for crops irrigated at optimum irrigation management. The total water required for crops grown under these production conditions includes available spring soil moisture, growing season precipitation and effective irrigation water.
Optimum irrigation production is achieved for most cereal and oilseed crops when total water use is in the range of 16 to 20 inches (400 and 500 mm) per season, depending on the irrigated crop. Soil moisture should not drop below a safe 60 per cent plant-available water depletion point in the top 0 to 50 cm of soil during the growing season, which occurs when crops have used up 40 per cent of the readily plant-available water in the root zone. Once soil moisture drops below 60 per cent safe depletion, a plant cannot take up water at a sufficient rate to meet transpiration needs, causing the plant to undergo stress. The longer the period of stress, the greater the potential yield reduction.
The following figures provide crop yield information with N fertilizers:
- Figure 1 provides predicted yields for soft white spring wheat, hard red spring wheat, durum wheat, prairie spring wheat with increasing rates of N fertilizer.
- Figure 2 provides predicted yields of feed barley, malting barley and triticale.
- Figure 3 provides predicted yields for canola and flax.
- Figure 4 provides predicted yields for barley and triticale silage with increasing rates of N fertilizer.
The curves show the effect of increasing rates of N fertilizer banded at a depth of 3 to 4 inches (7.5 - 10.0 cm) in the late fall or spring. The effect of nitrogen fertilizer on yield is significantly affected by method of placement. Detailed yield increase charts are in Tables A 1 to A 11 in the appendix at the end of this Agdex factsheet.
The amount of N fertilizer required for maximum economic yield can be estimated by using the cost of N fertilizer per pound and the expected value of the crop per bushel at harvest. If the combined soil and fertilizer N level used exceeds 180 to 200 lb/ac, lodging may occur with crop varieties that do not have very good lodging resistance. Generally, the combined level of soil N and fertilizer N should not exceed 200 lb/ac to avoid agronomic problems of lodging, excessive vegetative growth and delayed maturity and environmental problems of nitrate leaching. Under high fertility conditions, the selection of lodging-resistant varieties is very important.
When N fertilizer levels are increased, the protein content of the seed produced increases. Higher protein levels in hard red spring wheat and durum wheat are economically desirable; however, high protein can be a serious quality problem for malting barley and soft wheat. As long as adequate soil water is available, good irrigation management will normally help keep protein levels at an acceptable level for malt barley and soft wheat.
Leaching of nitrate-nitrogen through the root zone into the groundwater is a serious environmental concern, which demands careful management when large amounts of N fertilizer or manure are applied to achieve maximum crop yield. Studies in Alberta have shown that high fertility used to improve crop yield resulted in a marked increase in soil nitrate-nitrogen content after only four years. High fertility coupled with other intensive management inputs also resulted in a substantial increase in soil nitrate-nitrogen.
Maximum amounts of soil and fertilizer N to avoid serious agronomic and quality problems are suggested in Table 4.
Table 4. Suggested maximum agronomic levels of soil nitrogen
(0 - 24 inches) plus applied fertilizer nitrogen. |
| Crop | Max N (lb/ac) |
| Soft white spring wheat | 200 |
| Hard red spring wheat | 180 |
| Durum wheat | 180 |
| Prairie spring wheat | 200 |
| Feed barley | 200 |
| Malting barley | 160 |
| Triticale (Grain) | 200 |
| Canola | 200 |
| Flax | 160 |
| Barley (Silage) | 200 |
| Triticale (Silage) | 200 |
To determine the economic application rate of N fertilizer, the following factors must be evaluated:
- soil N level
- previous crop
- price of N fertilizer
- crop value
- ratio of marginal economic return
- level of irrigation management
Examples of estimating the economic rate of N fertilizer required for canola are provided in Tables 5 and 6. Each example is based on soil test N (0 - 24 inches) of 50 lb/ac and uses two fertilizer price scenarios.
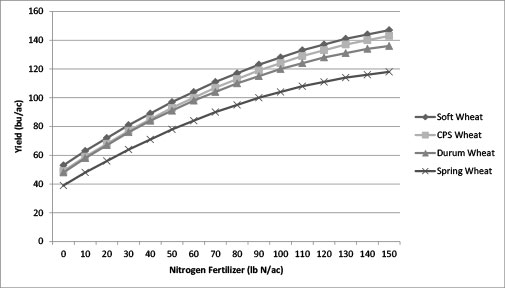
Figure 1. Approximate yield response of soft wheat, durum wheat, CPS wheat and spring wheat to increasing rates of nitrogen fertilizer when soil test N in the 0 to 24 inch depth is 30 lb N/ac.
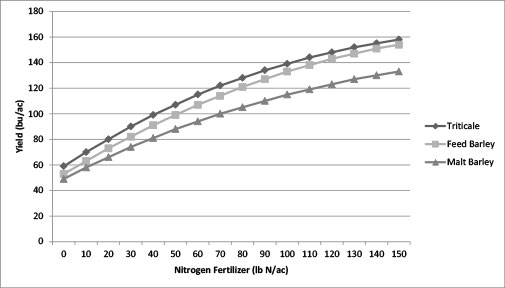
Figure 2. Approximate yield response of malt barley, feed barley and triticale to increasing rates of nitrogen fertilizer when soil test N in the 0 to 24 inch depth is 30 lb N/ac.
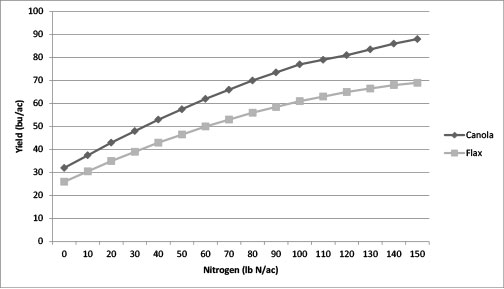
Figure 3. Approximate yield response of canola and flax to increasing rates of nitrogen fertilizer when soil test N in the 0 to 24 inch depth is 30 lb N/ac.
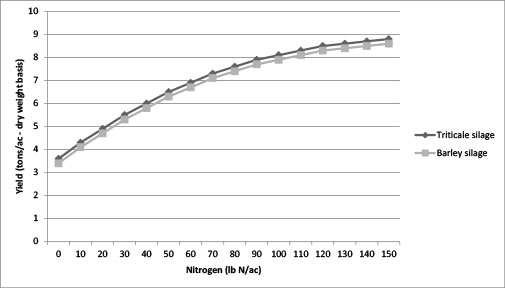
Figure 4. Approximate yield response of barley silage and triticale silage to increasing rates of nitrogen fertilizer when soil test N in the 0 to 24 inch depth is 30 lb N/ac
In Table 5 for canola, the first scenario used a lower nitrogen fertilizer cost ($0.60/lb) and a moderate value for canola ($10.00/bu). In this scenario, it would be economical to apply N fertilizer at a rate of up to 150 lb/ac, which is the top end of the chart.
The second scenario used a higher nitrogen fertilizer cost ($0.80/lb) and the same moderate value for canola ($10.00/bu). An economic N fertilizer rate of 150 lb/ac is predicted at a 2:1 ratio, where a two-dollar return is expected from the last dollar spent on fertilizer. At a 3:1 ratio, 110 lb/ac of N fertilizer would be economical. Producers frequently use a 2:1 ratio, but can select any cost-benefit ratio to suit their situation and yield goal.
| Table 5. Determination of economic nitrogen fertilizer response of canola, assuming optimum irrigation management when soil test nitrogen is 50 lb/ac (0 - 24 inch depth) using two scenarios. Fertilizer added is in lb/ac and yields are in lb/ac. The bold numbers indicate the point where marginal economic return is 2:1and 3:1. |
| N fertilizer added (lb/ac) | Expected yield | Added yield increase /10 lb/ac N | Scenario 1: | Scenario 2: |
Fertilizer cost
$0.60/lb | Canola value
$10.00/bu | Fertilizer cost
$0.80/lb | Canola value
$10.00/bu |
| 0 | 43 | | | | | |
| 10 | 48 | 5 | 6.00 | 50 | 8.00 | 50 |
| 20 | 53 | 5 | 6.00 | 50 | 8.00 | 50 |
| 30 | 57.5 | 4.5 | 6.00 | 4.5 | 8.00 | 4.5 |
| 40 | 62 | 4.5 | 6.00 | 4.5 | 8.00 | 4.5 |
| 50 | 66 | 4 | 6.00 | 40 | 8.00 | 40 |
| 60 | 70 | 4 | 6.00 | 40 | 8.00 | 40 |
| 70 | 73.5 | 3.5 | 6.00 | 35 | 8.00 | 35 |
| 80 | 77 | 3.5 | 6.00 | 35 | 8.00 | 35 |
| 90 | 79 | 3 | 6.00 | 30 | 8.00 | 30 |
| 100 | 81 | 3 | 6.00 | 30 | 8.00 | 30 |
| 110 | 83.5 | 2.5 | 6.00 | 25 | 8.00 | 25 3:1 |
| 120 | 86 | 2.5 | 6.00 | 25 | 8.00 | 25 |
| 130 | 88 | 2 | 6.00 | 20 | 8.00 | 20 |
| 140 | 90 | 2 | 6.00 | 20 | 8.00 | 20 |
| 150 | 91.5 | 1.5 | 6.00 | 15 | 8.00 | 15 2:1 |
In Table 6 for spring wheat, the first scenario used a lower nitrogen fertilizer cost ($0.60/lb) and a moderate value for wheat ($6.00/bu). In this scenario, it would be economical to apply N fertilizer to a rate of 130 lb/ac at a 2:1 ratio, where a two-dollar return is expected from the last dollar spent on fertilizer. At a 3:1 ratio, 110 lb/ac of N fertilizer would be economical.
The second scenario used a higher nitrogen fertilizer cost ($0.80/lb) and the same moderate value for wheat ($6.00/bu). An economic N fertilizer rate of 110 lb/ac is predicted at a 2:1 ratio, where a two-dollar return is expected from the last dollar spent on fertilizer. At a 3:1 ratio, 90 lb/ac of N fertilizer would be economical. Producers frequently use a 2:1 ratio, but can select any cost-benefit ratio to suit their situation and yield goal.
| Table 6. Determination of economic nitrogen fertilizer response of spring wheat, assuming optimum irrigation management when soil test nitrogen is 50 lb/ac (0-24 inch depth) using two scenarios. Fertilizer added is in lb/ac and yields are in lb/ac. The bold numbers indicate the point where marginal economic return is 2:1 and 3:1. |
| N fertilizer added (lb/ac) | Expected yield | Added yield increase /10 lb/ac N | Scenario 1: | Scenario 2: |
Fertilizer cost
$0.60/lb | Spring wheat value
$6.00/bu | Fertilizer cost
$0.80/lb | Spring wheat value
$6.00/bu |
| 0 | 56 | | | | | |
| 10 | 64 | 8 | 6.00 | 48 | 8.00 | 48 |
| 20 | 71 | 7 | 6.00 | 42 | 8.00 | 42 |
| 30 | 78 | 7 | 6.00 | 42 | 8.00 | 42 |
| 40 | 84 | 6 | 6.00 | 36 | 8.00 | 36 |
| 50 | 90 | 6 | 6.00 | 36 | 8.00 | 36 |
| 60 | 95 | 5 | 6.00 | 30 | 8.00 | 30 |
| 70 | 100 | 5 | 6.00 | 30 | 8.00 | 30 |
| 80 | 104 | 4 | 6.00 | 24 | 8.00 | 24 |
| 90 | 108 | 4 | 6.00 | 24 | 8.00 | 24 3:1 |
| 100 | 111 | 3 | 6.00 | 18 | 8.00 | 18 |
| 110 | 114 | 3 | 6.00 | 18 3:1 | 8.00 | 18 2:1 |
| 120 | 116 | 2 | 6.00 | 12 | 8.00 | 12 |
| 130 | 118 | 2 | 6.00 | 12 2:1 | 8.00 | 12 |
| 140 | 119 | 1 | 6.00 | 6 | 8.00 | 6 |
| 150 | 120 | 1 | 6.00 | 6 | 8.00 | 6 |
Phosphorus (P)
Soil tests are very useful to determine the amount of plant-available phosphorus (P) in the soil and then make fertilizer recommendations in terms of phosphate (P205). The price of the fertilizer is based on the percentage of (P205) in the fertilizer. To convert P to (P205), multiply by 2.3 (e.g., 1 0 lb/ac of P = 23 lb/ac of (P205).
Soil tests estimate the P-supplying power of soils. These tests attempt to measure the plant-available portion of the total P supply in the soil. In the past two decades, some soils that received P fertilizer have benefited in a buildup of residual fertilizer P, most of which remains in plant-available form.
Irrigated soils in southern Alberta often have moderate to high levels of plant-available soil P, often in the range of 30 to over 100 lb/ac in the surface soil, as a result of good fertilization practices over the past 30 to 50 years. Some irrigated soils have very high to excessive soil P levels as a result of frequent manure application over the past 20 to 30 years. Soils with plant-available P levels over 200 lb P/ac should not receive either manure or phosphate fertilizer application until soil P levels have been drawn down to levels of less than 150 lb P/ac.
Crops frequently respond to phosphate fertilizer on soils that are low to moderate in available soil P. However, crop yield response to P is generally much smaller than with N fertilizers.
The Modified Kelowna soil test is the best recommended test to estimate plant-available soil P. Some phosphorus soil tests such as the Bray, Miller & Axley or other soil tests are not effective in predicting when a crop will respond to P fertilizer application in southern Alberta soils.
Sometimes soils that test high in plant-available P still respond to added P fertilizer. This situation tends to occur in wet, cool spring conditions when soil P is somewhat less available due to environmental conditions.
Care is required when fields are sampled for nutrient levels. Phosphate fertilizer is normally seed placed or banded causing soil P levels to vary over very short distances of a few centimeters, necessitating great care in obtaining representative soil samples of the field. Ideally, soils should be sampled between the rows if P fertilizer is seed placed to avoid hitting these bands of fertilizer. Accidental sampling of P fertilizer bands can cause concerns for producers trying to optimize their P fertilizer use through the interpretation of soil tests. The general phosphorus fertilizer recommendations used by Alberta Agriculture and Rural Development at various soil test levels are presented in Table 7.
| Table 7. General phosphorus fertilizer recommendations at various soil test levels. |
Soil test level
P (lb/ac) | Soil test rating | P205 recommendation
(lb/ac) |
| (0 - 6 inch depth) | Grains | Canola | Flax |
| > 100 | High | 0 | 0 | 0 |
| 80 to 100 | Adequate1 | 20 | 20 | 15 |
| 70 - 80 | 25 | 30 | 20 |
| 60 - 70 | Marginal | 30 | 40 | 25 |
| 50 - 60 | 35 | 45 | 30 |
| 40 - 50 | 40 | 50 | 35 |
| 30 - 40 | Deficient | 45 | 55 | 40 |
| 20 - 30 | 50 | 60 | 45 |
| 10 - 20 | Very
deficient | 55 | 65 | 50 |
| 0 - 10 | 60 | 70 | 50 |
Note: Modified Kelowna soil test method used to determine soil P.
1When soil test P is adequate, a maintenance application of P is still advised to ensure adequate P for early spring growth and to replace P that is taken up by the crop.
For greatest efficiency, phosphate fertilizer should be either seed placed or side banded at the time of planting. For oilseed crops, germination and emergence can be substantially reduced if more than 15 lb/ac of P205 is seed-placed with canola or 10 - 15 lb/ac of P205 is seed placed with flax.
Southern Alberta research has shown that P uptake efficiency was only 12 to 15 per cent when N (108 lb/ac) and P205 (54 lb/ac) were dual banded. When N and P were banded separately, P uptake efficiency was 30 to 35 per cent.
After nitrogen fertilizer converts to nitrate, the plant-available N form that is mobile in soil, the nitrate will radiate out from the dual-banded N-P fertilizer, while the immobile P does not move in soil. At high concentrations of N fertilizer, plant roots are unable to penetrate the concentrated N-P band to take up P fertilizer efficiently.
When high rates of N fertilizer (>70 lb/ac) are used, banding N and seed-placing P generally gives a better response than dual deep-banded N and P. Therefore, at higher rates of N fertilizer, phosphate fertilizer should not be placed in the N band.
Recent studies have compared residual effects of P fertilizer with repeated annual seed-placed applications and manure application. Investigations of the forms of applied P remaining in soil showed that after five years, less than 15 per cent of available P had been converted to unavailable forms. This remaining fertilizer P should be available for subsequent crops for many years.
Ideally, it is recommended to apply P fertilizer just before or at the time of planting for most annual crops. Moderate to large one-time applications of fertilizer P on some soil types may be an alternative to the traditional approach of applying P annually.
Such a practice offers several agronomic advantages. A large, single application of P can supply the future P needs of a crop such as canola, which has a high P requirement but does not tolerate high rates of seed-placed P. Residual soil P provides a means of overcoming the variable P deficiency that is often associated with machine-levelled or eroded land.
The negative factors of this practice include high initial cash costs and potential for inducing zinc or copper micronutrient deficiencies, particularly on low organic matter or sandy soils. However, recent work with irrigated Timothy at Lethbridge and Bow Island showed annual P fertilizer was superior to a one-time application. Therefore, it is recommended to apply P fertilizer annually to most annual crops.
The fundamental concern producers have is how much phosphate fertilizer to apply to a crop each year. When soil test P levels are low or moderate and limited amounts of P fertilizer have been applied in previous years, following soil test recommendations is important. Table 7 provides good general recommendations. If soil test P levels are moderate to high and significant P fertilizer has been applied in the past 10 to 20 years, an annual maintenance application of phosphate fertilizer is recommended to meet crop requirements and replenish the soil P that is removed.
Potassium (K)
Soil tests determine the amount of plant-available and exchangeable potassium (K) in the soil. Fertilizer recommendations are made in terms of potassium oxide (K2O). The price of K fertilizer is based on the percentage K2O in the fertilizer product. To convert K to K2O, multiply by 1.2 (e.g., 10 lb/ac of K = 12 lb/ac of K2O). Most potassium fertilizer sold in Alberta is potassium chloride (KCI) and is often referred to as muriate of potash or simply as potash.
Most irrigated crops have a relatively high K requirement, taking up nearly as much potassium as nitrogen (Table 1). About 20 per cent of the K taken up by cereal and oilseed crops is contained in the seed, and the remaining
80 per cent of K is contained in leaves and stems, which are normally returned to the soil, except for silage crops or if straw is baled and removed from the field.
Generally, most irrigated soils in southern Alberta have moderate to high levels of exchangeable soil K, primarily because of the abundance of K-bearing soil clay minerals. Soil test K levels frequently range from 400 to over 1,000 lb/ac.
In K fertilizer research trials across southern Alberta, application of K has rarely resulted in a yield response for cereal or oilseed crops, reduced lodging or reduced disease levels. General recommendations (Table 8) suggest K be applied when soil test levels are less than 300 lb/ac for cereal and oilseed crops. Few southern Alberta fields test less than 300 lb/ac. Potassium may be required on intensively cropped sandy soils with low K levels, where potatoes, sugar beets or alfalfa are frequently grown in the crop rotation.
| Table 8. Potassium fertilizer recommendations for irrigated grains and oilseed crops in Alberta. |
| Soil test level K (lb/ac)z | K2O recommendation (lb/ac) |
| (0 - 6 inch depth) | Grains | Canola | Flax |
| > 300 | 0 | 0 | 0 |
| 250 - 300 | 20 | 30 | 20 |
| 200 - 250 | 40 | 50 | 25 |
| 150 - 200 | 50 | 60 | 30 |
| 100 - 150 | 60 | 100 | 60 |
| 50 - 100 | 100 | 120 | 100 |
| 0 - 50 | 120 | 140 | 120 |
z Based on the Modified Kelowna soil test method.
Potassium is less mobile in soil than nitrate-nitrogen but more mobile than phosphate. Potassium fertilizers are more efficient when seed placed or banded. Potassium chloride fertilizer has a high salt index; therefore, even small amounts of seed-placed potassium with canola or flax may reduce germination and emergence. If potassium is required, banding before seeding or broadcast incorporation can be used, or if preferable, side band the K fertilizer at the time of seeding.
Sulphur (S)
Sulphate-sulphur levels in irrigated soils in southern Alberta are usually adequate for crop growth. Much of the S in the topsoil is contained in the organic matter (200 to 600 lb/ac) and is slowly released as plant-available sulphate-sulphur (SO4-S), the form that crops require, through mineralization and breakdown of organic matter by soil micro-organism activity.
Generally, most irrigated fields in southern Alberta have good levels of sulphate in subsoils in the form of gypsum salts (calcium sulphate) to meet crop requirements. Further, irrigation water contains substantial amounts of sulphate-sulphur. Approximately 30 lb/ac of sulphate-sulphur is added to the soil with each 12 inches of applied irrigation water. Therefore, irrigated soils in southern Alberta often have adequate levels of sulphate-sulphur for crop production.
Sulphate-sulphur, like nitrate-nitrogen, is very mobile in soil. After heavy precipitation or irrigation events, leaching of sulphate from the topsoil into subsoil is a concern. Sandy irrigated soils have the greatest potential for sulphate leaching.
After significant precipitation that can cause leaching, a deficiency in plant-available sulphate-sulphur may develop in surface soil.
A soil test for S can help determine if S fertilizer is required. Samples should be taken separately from the 0 to 6, 6 to 12 and 12 to 24 inch depths to determine the level of S at various depths.
Table 9 provides a general guide to determine if S fertilizer is required. It is important to apply sulphate fertilizer to crops, particularly oilseed crops, when a surface soil is low in sulphate-sulphur to ensure adequate S nutrition for optimum crop production.
Research in southern Alberta found that irrigated crops do not frequently respond to S fertilizer, even at lower S sites. There are several explanations for this result:
- Soils with low levels of sulphate-sulphur (S04-S) in the surface soil were often underlain by subsoils containing adequate levels of sulphate.
- Sulphate-sulphur in irrigation water provided ample S to growing crops.
- Rainfall provided about 5 lb/ac of S annually.
| Table 9. Sulphur fertilizer recommendations for irrigated crops in Alberta. |
| Soil test level S (lb/ac)z | (S recommendation (lb/ac) |
| (0 - 6 + 6 to 12 inch depth) | Grains | Canola | Flax |
| 30 | 0 | 0 | 0 |
| 20 - 30 | 0 | 10 | 5 |
| 15 - 20 | 5 | 15 | 10 |
| 10 - 15 | 10 | 20 | 15 |
| 5 - 10 | 15 | 25 | 20 |
| 0 - 5 | 20 | 30 | 25 |
z CaCl extraction method.
Micronutrients
Considerable micronutrient field research has been conducted with irrigated grain and oilseed crops. Soil test range levels (Table 10) were developed from southern Alberta research. However, from the research that has been conducted, almost all southern Alberta soils contain adequate micronutrient levels and do not require micronutrient fertilizers for cereal and oilseed production.
| Table 10. Range levels of micronutrients in soils for cereal and oilseed crops grown under irrigation in southern Alberta. |
| Nutrient | Low | Medium | Adequate |
ppm |
| Boron | 0.0 - 0.2 | 0.2 - 0.6 | > 0.6 |
| Chlorine* | 0.0 - 8.0 | – | – |
| Copper | 0.0 - 0.2 | 0.2 - 0.5 | > 0.5 |
| Iron | 0.0 - 2.0 | 2.0 - 4.5 | > 4.5 |
| Manganese | 0.0 - 1.0 | – | > 1.0 |
| Zinc | 0.0 - 0.2 | 0.2 - 0.5 | > 0.5 |
*This level is used by some labs as a critical level for recommending chlorine for disease suppression in cereals. Alberta research has not been done to establish a critical level.
Micronutrient deficiencies have rarely been observed in irrigated grain or oilseed crops, and yield increases have not been recorded in research trials. Extensive micronutrient fertilizer trials were conducted from 1983 to 1991, and no responses to any micronutrients by small grains, canola or flax were noted in that study. Subsequent micronutrient research with irrigated crops has not shown micronutrient fertilizer responses with cereal or oilseed crops. However, responses to zinc have been obtained with some special crops such as dry beans but only on coarse textured soils.
Micronutrient fertilizers may be required on land that has been severely eroded or that has been machine levelled in the past, thus exposing micronutrient-deficient subsoil. In these cases, applications of micronutrients may be necessary to prevent future deficiencies. Normally, micronutrient fertilizers are not required by irrigated cereal or oilseed crops grown on normal, productive soils in southern Alberta.
Growers who are concerned about micronutrient deficiencies should consult a qualified crop specialist, call the Alberta Ag-Info Centre – call toll free 310-FARM (3276) – and review Alberta Agriculture’s factsheet Agdex 531 - 1, Micronutrient Requirement of Crops in Alberta. Producers who wish to try micronutrient fertilizers should soil test first and apply replicated field test strips to carefully evaluate the results.
Fertilizer Application
Crop response to various fertilizers differs; thus, the choice of products and methods of application should be based on several factors: the crop, type of fertilizer, method of application, the cost per unit of the nutrient and the relative convenience of using the product.
Nitrogen - Anhydrous ammonia (82-0-0) is the most concentrated (highest analysis) and normally the least expensive form of N fertilizer. It can be applied in late fall or early spring when soil conditions are suitable. Gaseous losses normally are not significant if the fertilizer is spiked into moist soil to a depth of 3 to 4 inches (7 - 10 cm).
Of the granular products available, urea (46-0-0) is the highest analysis and generally the least expensive. The most effective and efficient method of urea application is to side or mid-row band at the time of seeding. If urea is banded in the fall, producers should do it in late fall as close to freeze-up as possible to minimize conversion to nitrate, which will minimize potential losses. Urea can be efficiently banded in the spring, but spring application can result in loss of soil moisture and reduced seedbed quality.
Surface-applied urea can be lost to the air by changing from urea to gaseous ammonia (volatilization). If urea is broadcast, it should be well incorporated into soil within 24 hours to minimize volatilization losses. Therefore, if urea is broadcast onto the soil surface, incorporate the urea as soon as possible after surface application.
Ideally, when broadcasting urea, air temperatures should be less than 10�C and soil temperatures should be less than 5�C to reduce the potential loss of N to volatilization. If urea is used for in-crop application, an irrigation of at least 0.5 to 0.75 inches (12 - 18 mm) should be applied as soon as possible to minimize volatilization and move the urea into the soil for conversion to nitrate for efficient plant uptake.
Some irrigation producers use ESN (Environmentally Smart Nitrogen) (45-0-0), a polymer-coated urea product. When soil applied, ESN fertilizer releases slowly with release peaking at about 30 days and full release at about 60 days, under normal soil moisture and temperature conditions. Due to its slow release characteristics, ESN fertilizer is considered to be more efficient and can reduce N losses. The slow release characteristics may also contribute to higher grain protein content. The ESN (coated urea) generally costs about 12 to 15 cents/lb of N more than conventional urea.
Urea-ammonium nitrate (UAN) liquid fertilizers (28-0-0) contain urea and ammonium nitrate forms of N dissolved in water. UAN tends to be more expensive than other N fertilizer products. Some producers find that pumping liquids may be convenient since less time and labour are required if the producer has the necessary equipment. Application of 28-0-0 in the fall is not recommended as the nitrate in the liquid fertilizer is prone to leaching and denitrification.
Liquid N fertilizer can be banded before seeding or side banded or mid-row banded at the time of seeding. Liquid fertilizers are especially suited to fertigation. It is important to note that urea in the liquid fertilizer is subject to the same potential volatilization losses as granular urea and must be managed carefully to prevent gaseous losses.
Blended fertilizers (27-14-0, 24-17-0, 27-27-0, etc.) are physical mixes of urea, phosphate, and at times, other nutrient fertilizers. These mixes can be custom blended to a producer’s specifications and can include K, S or micronutrients, if required. They are more convenient to use than the basic products applied separately.
Phosphorus - Mono-ammonium phosphate is the most common form of granular phosphate fertilizer sold in Alberta. It usually contains 11 to 12 per cent N and 51 to 55 per cent phosphate (P205). The commercial liquid phosphate fertilizer sold is ammonium polyphosphate and usually contains 10 per cent N and 34 per cent phosphate (P205). Mono-ammonium phosphate is the form of P most commonly used. Research has shown this form to be slightly more available than triple superphosphate (0-45-0) or diammonium phosphate (16-48-0), particularly on high pH soils. The liquid polyphosphate (10-34-0) is applied in a solution form. The polyphosphate breaks down rapidly in the soil to ortho phosphate and, therefore, has similar availability as mono-ammonium phosphate.
Potassium - Potassium chloride (KCl), often referred to as muriate of potash, is the form of potassium fertilizer most commonly sold in Alberta. Potassium chloride (0-0-60, 0-0-62) is the commonly used form of K fertilizer.
Sulphur - Sulphate-sulphur is normally not deficient in irrigated soils. However, if S is deficient in soil and is needed by the crop, fertilizers containing sulphate-sulphur such as ammonium sulphate [21-0-0-(24)], which contains 24 per cent SO4-S, are best. This fertilizer contains sulphate, which is immediately available to the crop. Other fertilizer forms, which contain elemental (pure) S (example: 0-0-0-90), are only recommended if S levels need to be built up over time. Elemental S must be converted by micro-organisms to the sulphate form before it can be utilized by crops. Conversion to sulphate requires months to several years under warm, moist conditions. Conversion is too slow to fully satisfy crop needs in the year of application on deficient soils. Elemental forms can be used for long-term S building over several years.
Micronutrient Fertilizers - For specific information on micronutrient recommendations, sources and methods of application for specific crops on problem soils, consult a qualified soil or crop production specialist.
Micronutrient fertilizers are available in organic and inorganic forms. Table 11 lists some common inorganic micronutrient fertilizers. The inorganic forms are the most economical. The organic sources are synthetic chelates, which are considered to be more available in some soil types.
| Table 11. Common inorganic micronutrient fertilizers. |
| Nutrient | Form | % of nutrient in product |
| Boron | Borate | 14 - 20 |
| Borax | 11 |
| Copper | Copper sulphate | 25 |
| Iron | Iron sulphate | 19 |
| Manganese | Manganese sulphate | 26 |
| Zinc | Zinc sulphate | 18 - 23 |
Livestock Manure - Manure is an excellent, slow release fertilizer that contains a number of plant nutrients. The composition of various types of manure varies widely. The differences are due to the type of animal, the type of feed and the conditions under which the manure is collected and stored. Storage conditions affect the moisture content. The quantity of bedding materials contained in manure affect the composition of nutrients such as N, P and K. Table 12 provides average values, but considerable variation can occur. The best way to determine nutrient level in manure is to send samples to an analytical laboratory.
| Table 12. Approximate nutrient content of animal manure. |
| Type of manure | Waste handling system | Nutrient (lb/ton raw waste) |
Dry matter (%) | Nitrogen available* | Total nitrogen** | P205 | K2O |
| Swine | Without bedding | 18 | 6 | 10 | 9 | 8 |
| With bedding | 18 | 5 | 8 | 7 | 7 |
| Beef Cattle | Without bedding | 15 | 4 | 11 | 7 | 10 |
| With bedding | 50 | 8 | 21 | 18 | 2 |
| Dairy Cattle | Without bedding | 18 | 4 | 9 | 4 | 10 |
| With bedding | 21 | 5 | 9 | 4 | 10 |
| Poultry | Without bedding | 45 | 26 | 33 | 48 | 34 |
| With bedding | 75 | 36 | 56 | 45 | 34 |
| Deep pit (compost) | 76 | 44 | 68 | 64 | 45 |
*Primarily ammonium N, which is available to the plant during the growing season.
** Ammonium N plus slow releasing organic N.
Source: Sutton et al. Purdue Univ. 1D-1 01 (1975).
Manure storage and handling are important because these factors affect nutrient content and release for plant use. Storage of manure for a longer time can affect the retention of the nutrients. Loss of N in the urea form is the most critical. The hydrolysis of urea and formation of volatile ammonia (NH3) gas can be difficult to avoid.
Improper storage of manure in loosely stacked piles will lead to rapid evolution of the gas. Good aeration encourages microbial activity that causes the pile to heat excessively and dry rapidly. Any handling of manure that contributes to heating or drying will hasten the loss of NH3. Therefore, storage of manure in a compacted state is desirable. Compaction retards heating and drying as well as promotes anaerobic decomposition and the production of various organic acids capable of neutralizing and converting NH3 to non-volatile salts.
The best method for field application of manure is spreading of solid or liquid material followed by immediate incorporation when weather and soil conditions permit. Injection of slurry or liquid manure into soil is very effective.
The method of application greatly affects nitrogen loss (Table 13). Immediate incorporation of manure will minimize N volatilization. In liquid systems, the addition of nitrification inhibitors has been used with some success.
| Table 13. Effect of method of application of manure on nitrogen volatilization losses. |
| Method of application | Type of waste | Nitrogen
loss*(%) |
| Broadcast without incorporation | Solid | 21 |
Liquid | 27 |
| Broadcast with incorporation** | Solid | 5 |
Liquid | 5 |
| Knifing | Liquid | 5 |
| Irrigation | Liquid | 30 |
* Percentage of total N in waste that was lost within four days after application.
** Cultivation immediately after application.
Source: Sutton et al. Purdue Univ. 1D-101 (1975).
Winter application of manure onto frozen ground is not recommended due to very high potential nitrogen volatilization losses and potential runoff losses in spring.
From Table 12, under beef cattle with bedding, if N is assumed to be worth $0.75/1b, phosphate is $0.50/lb and potash is $0.50/1b, then a ton of manure would be worth about $25.75 on a wet basis. Alberta research has shown that about 25 to 35 per cent of feedlot manure decomposes in the first year. Researchers have observed responses to manure four years after the last application, and residual effects may persist for up to 10 years or more.
Feedlot manure weighs 30 to 40 lb/cubic foot, depending on the amount of bedding and the moisture content. A reasonable estimate of tons per acre of applied manure can be determined by calculating the capacity of the manure spreader, number of loads spread and number of acres fertilized. An analysis of the manure for nutrient and moisture content would make the estimate of nutrient application much more accurate.
Manure can be better than commercial inorganic fertilizer:
- Manure is a slow release fertilizer that contains nutrients in organic form that slowly change to inorganic forms over the growing season to supply nutrients to the crop.
- Manure increases the water-holding capacity of the surface soil.
- Manure helps to bind soil particles together to reduce soil erosion potential. This action improves soil structure and helps prevent soil crusting problems.
Rate, Placement and Time of Fertilizer Application
Recent research with irrigated cereal crops examined fall versus spring-banded and broadcast-incorporated N fertilizer. Results showed that banded N is generally more effective by up to 20 per cent, versus broadcast-incorporated fertilizer. Further, nitrogen fertilizer applied in spring is generally about 10 per cent more effective versus fertilizing in late fall. However, variable environmental conditions can result in smaller or greater per cent differences.
Recent research results showed that fall-banded ESN or a 50:50 blend of urea + ESN was occasionally superior to urea fertilizer. However, results were not consistent every year due to different environmental conditions.
Generally, all spring-applied nitrogen fertilizers perform equally well when banded at a depth of 3 to 4 inches
(7.5 - 10 cm) and with a shank spacing of not more than 12 inches (30 cm) wide. If urea (46-0-0) is broadcast and incorporated into the soil, producers should increase the application rate by 10 to 15 per cent due to reduced efficiency of broadcast versus banded application and potential volatilization (loss of nitrogen to the atmosphere). Volatilization losses are greater under the following conditions:
- soil temperatures are greater than 5�C
- air temperatures are greater than 10�C
- less than 6 mm (� inch) of rain or irrigation is received
- surface soil is coarse textured
- soil is low in organic matter content
- surface soil is high in lime
- day versus night humidity is variable
It is very important to incorporate urea fertilizer immediately after broadcasting to minimize volatilization losses.
The relative effectiveness of fall versus spring applications of N fertilizer is also a consideration. Fall fertilization can range from very effective to disastrous, depending on soil type, form of N fertilizer used and how it is applied.
Table 14 gives a general summary of the relative effectiveness of methods and times of nitrogen application.
| Table 14. Generalized effect of different nitrogen application methods and dates on crop yield. |
| Application method | Effectiveness | Variability |
Spring broadcast
and incorporated | 100% | Slight |
| Spring banded | 115% | Little to none |
Fall broadcast
and incorporated | 90% | Moderate to high |
| Fall banded | 100% to 110% | Slight |
In all cases, spring-banded N is superior to spring- broadcast N, but the differences at times are relatively small. Fall-broadcast N is the least effective method of application, and its efficiency declines with the length of time a soil is very wet in spring. Finally, fall-banded N is often just as effective as spring-banded N except when N is applied early in the fall or if soils are saturated with water for an extended period in early spring.
Ideally, for maximum N fertilizer use and efficiency, nitrogen fertilizer should be side or mid-row banded at the time of seeding cereal and oilseed crops.
| Table 15. Maximum rates of actual nitrogen (N) that can safely seed placed. |
| Crop | Soil texture | Seedbed
soil moisture | Phosphate
10% SBU | *Double disc or
narrow hoe drill
10% SBU | **Pneumatic seeder
50% SBU |
Urea | ESN | Urea | ESN |
lb/ac of Nitrogen (N) |
Wheat
Barley
Oats | Medium to
fine | Good
Poor | 60
60 | 30
20 | 75
50 | 50
40 | 120
100 |
| Coarse | Good
Poor | 50
50 | 20
15 | 45
30 | 40
25 | 100
80 |
Canola
Flax | All textures | Good
Poor | 10 - 15
0 - 10 | 10
0 | 45
30 | 20
10 | 80
60 |
* Conventional seeder: double disc or narrow hoe opener (1 - 2 inch spread of seed and fertilizer)
** Pneumatic seeder: cultivator with sweeps at 12 inch spacing giving 50 per cent spread of seed and fertilizer
The maximum rates of N and P fertilizers that can be safely placed with seed with hoe-type openers with a 10 per cent seedbed utilization (SBU) are provided in Table 15. These rates can be increased if the fertilizer is banded further away from the seed.
For conventional seeding equipment, urea fertilizer should not be applied at rates greater than 25 - 30 lb N/ac with cereal crops and should not be seed placed with oilseed crops if phosphate fertilizer is applied. The salt effects of seed-placed mono-ammonium phosphate are less than for N fertilizers. Up to 50 lb P205/ac of phosphate can be seed-placed with grains at with a 10 per cent seedbed utilization; however, rates should not exceed 15 lb P205/ac for canola and 10 lb P205/ac for flax.
Fertigation
Fertigation is the application of fertilizer through an irrigation system. It can be an excellent method of making in-season adjustments on soil nitrogen levels. Under normal fertilizer management, fertigation is not necessary on medium and fine textured soils. On these soil types, where leaching is not a problem, all nitrogen fertilizer can be applied before seeding to allow the crop to take up N as it is required. However, on sandy soils where leaching and downward movement of nitrate is a potential problem, fertigation of nitrogen fertilizer may be beneficial.
Fertigation works best with pivot irrigation systems, which can apply water lightly and frequently to avoid leaching water below the crop root zone. Even then, not more than 20 to 30 per cent of required N should be applied by fertigation. Generally, all fertigation applications of N should be completed by late June depending on crop growth stages. If fertigation is part of a fertilizer management plan and field conditions in June are excessively wet and preventing fertigation, a nitrogen deficiency could potentially occur.
If an N deficiency develops in early July, it takes time to apply the fertilizer and up to 7 to 10 days for the majority of the urea and ammonium nitrogen in the liquid fertilizer (28-0-0) to be converted to the nitrate-nitrogen form that crops can use. Such a delay could substantially reduce potential yields.
Computerized Fertilizer Recommendations
Irrigation producers in Alberta can take advantage of a computer program called Alberta Farm Fertilizer Information Recommendation Manager (AFFIRM), which was developed to assist producers and industry agronomists with determining optimum economic fertilizer recommendations.
The program can be downloaded from the Alberta Agriculture website free of charge. A user simply has to input soil analysis results, previous crop, crop to be grown, irrigation level, fertilizer price and estimated crop value at harvest. With this information, the program will calculate prices similar to that shown in Tables 5 and 6, which will assist with the selection of the most economic nitrogen fertilizer level for each crop. Recommendations are also made for P, K and S. Producers are encouraged to make use of this program when developing their fertilizer management plans for irrigated crops.
Summary
Nitrogen fertilizer can dramatically increase crop production when soil N levels are low to medium. Yield increase charts can be used to assist with determining economic nitrogen rates.
Crops respond to phosphorus fertilizer, but responses are not always well predicted by soil tests. A maintenance application of phosphate fertilizer annually is useful in maintaining good levels of soil P.
Potassium and sulphur normally are not usually limiting factors in the yield of irrigated cereal and oilseed crops. The naturally high levels of these elements in most southern Alberta soils are generally sufficient for optimum crop production.
Irrigated grain and oilseed crops rarely need additional micronutrients. Ongoing research is needed to improve micronutrient soil testing, calibration and interpretation.
Prepared by
Ross H. McKenzie PhD, Agronomy Research Scientist
Len Kryzanowski, Section Lead, Land Use
Doon Pauly, Agronomy Research Scientist
Alberta Agriculture and Rural Development
Other Alberta Agriculture sources of irrigated crop production information:
Irrigation Management in Alberta, Agdex 560-2
Crop Water Use and Requirements, Agdex 100/561-1
Irrigation Scheduling for Barley in Southern Alberta, Agdex 114/561-1
Irrigation Scheduling for Canola in Southern Alberta, Agdex 149/561-1
Irrigation Scheduling for Winter Wheat in Southern Alberta, Agdex 112/561-1
Irrigation Scheduling for Spring Wheat in Southern Alberta, Agdex 112/561-2
Varieties of Cereal and Oilseed Crops for Alberta, Agdex 100/32
Optimum Seeding Date and Rates for Irrigated Grain and Oilseed Crops, Agdex 100/561-2
More information
Contact Alberta Ag-Info Centre
Call toll-free 310-FARM (3276)
Appendix: Fertilizer response tables
Refer to the Fertilizer response tables for the Appendix showing yield increase tables for each of 11 crops.
Source: Agdex FS100/541-1. Revised February 2013. |
|