| | Abstract | Introduction | Objectives | Materials and methods | Results and discussion | Conclusions | Literature cited | Acknowledgements
November 2003
The appendices referenced in this paper are available in the full 38 page (1.5 MB PDF file) Evaluation of a Soil Quality Test Kit for Alberta - It will take you approximately 7 minutes to download if your connection speed is 28.8KB.
Abstract
Soil quality is defined as the ability of a soil to function within it's surroundings for its intended use. Soil quality evaluation is a tool to monitor changes in soil properties due to management and allows the determination of sustainable land use and management systems. One quantitative method of soil quality evaluation is a test kit that measures various dynamic soil properties in a field setting. The purpose of this investigation was to assess the United States Department of Agriculture-Agricultural Research Service (USDA-ARS) Soil Quality Test Kit under a variety of Alberta soil conditions. The kit was utilized in three different locations in the province to determine if the soil quality indicators measured by the field test kit are responsive to various soil management practices and to compare the results to those produced by standard analytical procedures. Results indicate that the test kit was able to detect differences between management practices in eight of eleven soil indicators measured. Significantly different (p � 0.05) results were found between soil analyzed by the test kit and standard methods for three tests that could be compared. Although differences were detected, the interpretation of the results is similar. The test kit was sensitive to changes in soil properties due to management and was able to identify potential problem areas in the fields tested. The kit was simple to use and provided relatively quick results without sending the sample off site to be analyzed. The test kit may facilitate sustainable management decisions and is a valuable tool to help increase the awareness of soil quality issues in Alberta.
Introduction
The dynamic interaction between various physical, chemical and biological soil properties which vary in space, time and intensity makes soil quality difficult to define, measure and explain. Each soil is unique because these dynamic properties are influenced by many external factors such as land use, land management, environmental interactions and socio-economic priorities. Soil quality is relative to its intended use and therefore the perception of a "good" soil depends on the function a soil is required to perform. As a result, the quality of a soil can be defined as its ability to perform a wide range of functions. One popular definition of soil quality is the "capacity of a specific soil to function, within natural or managed ecosystem boundaries, to sustain plant and animal productivity, maintain or enhance water and air quality, and support human health and habitation" (Karlen et al.1997).
Soil quality is considered a key element of sustainable agriculture (Warkentin 1995). It is essential to support and sustain crop, range and woodland production and helps maintain other natural resources such as water, air and wildlife habitat.
The assessment of soil quality is invaluable to determining the sustainability of land and soil management systems in the near and distant future (Doran and Parkin 1994). Soil quality evaluation is a tool to assess changes in a soil caused by external factors and provides information about the functional status of that soil at the time of assessment (USDA 2001a). Evaluations can be carried out through various methods including:
- basic soil indicators: physical, chemical and biological soil parameters that correlate well with ecosystem processes and serve as an estimate for soil functions that are difficult to measure.
- soil quality index: soil functions are assessed based on specific performance criteria established for each element, for a given ecosystem. Weighting factors are assigned to each soil element based on geographical considerations, societal concerns and economic constraints. Soil quality is estimated as the product of weighted sub-factors of each soil function.
- soil quality scorecard: a qualitative or subjective assessment approach that uses sensory descriptors to characterize soil health. It is usually used in the field by producers to assess individual soil properties using a non-numerical ranking such as healthy, impaired or unhealthy.
- soil quality test kit: a quantitative approach that measures physical, chemical and biological soil properties in the field using soil measurement equipment.
A commonality among these approaches is that they all use indicators to consider specific soil functions. Soil indicators are measurable soil or plant properties that indicate the capacity of a soil to function for a specific land use, climate and soil type. According to the United States Department of Agriculture (USDA 2001b), indicators chosen for an assessment should be:
- easy to measure
- able to detect changes
- be applicable in various field conditions
- encompass a variety of physical, chemical and biological soil properties.
The use of a combination of indicators that reflect agriculturally related soil functions is essential to fully evaluate the effects of land and soil management on soil function.
Soil quality test kit
A quantitative assessment kit has been developed by the United States Department of Agriculture-Agricultural Research Service to measure soil quality in the field (USDA 1999). The Soil Quality Test Kit is an assessment tool, which can provide results to:
- diagnose possible soil problems, such as compaction or salinity
- compare management systems
- monitor changes in soil quality over time.
It is designed to be a simple, low-cost method for land managers to routinely measure and monitor the quality of soil in their fields. It enables the user to perform in-situ soil tests, which cannot be effectively conducted by an analytical laboratory. The kit uses a minimum dataset of indicators chosen primarily for agricultural soil quality assessments, which are integrated into quantitative tests for physical, chemical and biological properties of the soil ecosystem. A total of 11 tests can be performed, including soil respiration, infiltration, bulk density, electrical conductivity, soil pH, soil nitrate content, aggregate stability, soil slaking, earthworm concentration and various observations of physical attributes which are important for explaining the results. Soil functions important to agricultural production include providing a medium for plant growth, regulation of the water supply and providing a habitat for organisms. These tests were chosen for their ability to indicate the capacity of a soil to function for agricultural uses.
Previous soil quality test kit evaluations
Previous evaluations of this test kit used comparative assessment approaches to compare the same soil subjected to different management practices (Evanylo and McGuinn 2000; Hubbs et al. 2000; Seybold et al. 2001; Seybold et al. 2002; Wilkins and Heideman 2000). Some of these studies also determined the accuracy of the test kit results by comparing them to standard laboratory procedures (Liebig et al. 1996; Evanylo and McGuinn 2000).
The study undertaken by Seybold et al. (2001) was conducted in a sandy loam soil located in the state of Michigan. Three different assessment approaches were used to trial the soil quality test kit. The first study compared management systems by using no-till and chisel till systems in a long-term (8 year) corn-soybean rotation, with no cover crop. The following tests were performed in the top 7.5 cm of each soil to evaluate the test kit: soil respiration, infiltration rate, bulk density, soil water content, slaking test, aggregate stability, soil pH and soil nitrate content. Significant differences were found between management systems for bulk density, aggregate stability and resistance to slaking with the no-till system having higher aggregate stability and resistance to slaking and lower bulk density. The second approach used by Seybold et al. (2001) compared results from a field with a sweet corn-broccoli rotation over a period of three years to determine if trends could be seen over time using the test kit. Tests for respiration, infiltration, bulk density, soil water content, resistance to slaking, aggregate stability, pH, EC and nitrates were conducted each July from a period of 1996-1998. Nitrate content and aggregate stability were found to increase over time. The third approach used by Seybold et al. (2001) to trial the test kit was to compare problem areas (wheel track areas) to non-problem areas (non-wheel track areas) within a conventionally tilled broccoli field. Respiration rate, infiltration rate, bulk density, soil water content and soil nitrate levels were determined with the test kit. With the exception of respiration rate, all measured indicators were significantly better in the non-wheel track sites. In all three assessment approaches, results showed that the test kit could provide useful information on the effect of management practices on surface soil quality and provide easily measured and interpreted results to aid in on-farm management decisions.
Hubbs et al. (2000) and Seybold et al. (2002) used the test kit to compare no-till versus conventional till silt loam soils in Tennessee. These studies demonstrated the use of the kit for assessing relative differences in surface soil quality and to evaluate the relative differences between two different tillage practices. Both studies measured respiration, infiltration, bulk density, gravimetric water content, slaking, aggregate stability, pH, EC and nitrates. In addition, Seybold et al. (2002) included the measurement of earthworms. Seybold et al. (2002) found that the test kit was able to distinguish significant differences between the two management systems for infiltration rate, water stable aggregates, respiration, resistance to slaking, earthworm content and soil water content. With the exception of the test for respiration, the no-till system yielded higher results than the conventionally tilled system, indicating a higher soil function. Hubbs et al. (2000) also concluded that the test kit was able to identify significant differences between management systems. The no-till system had significantly higher soil water content, aggregate stability, resistance to slaking and pH, while the conventional tillage site had significantly higher levels of nitrates and bulk density. Both studies concluded that the soil quality test kit was a good on-farm tool to compare relative changes in soil surface properties largely due to management and that it was able to distinguish differences in key soil properties on comparisons of long-term management systems.
The USDA test kit was used to demonstrate the effects of incorporated inorganic chemical fertilizer, cover crops, cotton gin trash compost and swine manure on soil quality in North Carolina (Evanylo and McGuinn 2000). The objective of that study was to compare the results of the field test kit with standard analytical procedures for tests including bulk density, soil pH, soil nitrate and soil water content, and determine if those same test kit indicators along with soil respiration and water infiltration, were responsive to various soil amendment treatments. Organic amendments improved infiltration, water holding capacity and bulk density compared to inorganic additions. Nitrates and respiration were also found to be the highest in the organic amendments. The test kit results were well correlated with standard laboratory analysis with the exception of test kit pH results, which yielded higher values. The authors found that the test kit procedures were easy to understand and quickly performed. Overall it was felt that the kit should be used to identify effects of management practices on general soil quality trends rather than to measure absolute values. The kit was further seen as a valuable tool for farmers, consultants and educators.
Another study involving the soil quality test kit determined the accuracy and precision of indicators including electrical conductivity, soil pH, soil nitrate level, soil water content and soil respiration (Liebig et al. 1996). These indicators were compared against standard laboratory analysis on cropland and grassland soils in North Dakota in 1994. Liebig et al. (1996) concluded that the test kit was able to demonstrate it's utility in providing accurate and precise methods to assess selected soil quality indicators, as no significant difference in pH, nitrates or gravimetric water content were found between the test kit results and those from standard laboratory analysis. Differences in respiration rate values were attributed to variations in in-situ versus in-vitro methodology, while variations in electrical conductivity were most likely due to spatial differences while sampling. Liebig et al. (1996) concluded that repeated measures of a soil indicate a comparable degree of precision between the test kit and standard analysis.
Wilkins and Heideman (2000) used the test kit to evaluate soil quality in four long-term experimental plots in the state of Oregon, with the objective of developing secondary school curriculum units based on the test kit equipment and procedures. The test sites included a grass pasture, continuous winter wheat, winter wheat-pea and a no-till winter wheat-fallow rotation. Aggregate stabilities were found to be lower than expected in all the plots and a low infiltration rate was experienced in the ploughed wheat and wheat/fallow systems. The authors felt that the test kit was easy to use and included comprehensive instructions. However, problems were noted with three of the tests. The infiltration rate test consistently yielded values higher than previous evaluations, which used a method that didn't allow lateral flow as the test kit method does. Errors occurred when measuring the sand content during the test for aggregate stability, as the last step in the procedure where Calgon is used to disperse the soil aggregates didn't completely disperse the soil. The authors also expressed concern with the method to measure bulk density and suggested that the upper two inches of the sample should not be included in the measurement because it is difficult to accurately determine the location of the soil surface due to large surface aggregates.
The above studies have used the USDA-ARS soil quality test kit to compare the same soil subjected to different management systems. In addition, two studies also determined the accuracy of the test kit by comparing the results to standard laboratory analysis of the same soil. Inconsistent results between indicators were seen due to the different soils, management systems and crop rotations used in each study. Comparison of results between the test kit and standard laboratory analysis also yielded inconsistencies. Although variable results were obtained with the test kit,it was concluded that the kit was good tool to identify and compare the effects of management practices on soil quality by providing easily measured and interpreted results. Because Alberta has a wide range of soils, climate and agricultural management systems, the Alberta Environmentally Sustainable Agriculture (AESA) Soil Quality Program was interested in experimenting with the test kit in Alberta conditions.
Objectives
The AESA Soil Quality Program has three main objectives:
- determine the state of soil quality across Alberta
- determine how soil quality integrates into environmental sustainability
- determine how soil quality is affected by different agricultural practices.
The AESA Soil Quality Program tested the validity of the soil quality test kit in Alberta during the spring of 2002. The objectives of the assessment were to:
- test the kit in a variety of management systems and soils across Alberta
- determine if the kit was easy to use in the field and if the results could be interpreted in the Alberta context
- compare the test kit results to standard laboratory analysis of the same soil.
Materials and Methods
Soil quality test kit
The USDA-ARS soil quality test kit was used to measure eleven soil quality indicators. The tests were soil respiration, bulk density, electrical conductivity, soil pH, estimated and exact soil nitrate levels, infiltration rate, earthworm content, soil aggregate stability, depth to resistance layer and soil water content.
The kit consists of a portable toolbox, which includes most of the equipment needed to complete the tests (Figure 1). It comes fully stocked, although some supplies need to be replenished such as pH calibration solution, CO2 detection tubes and nitrate detection strips. The user must supply distilled water and a shovel and access to electricity is necessary for completion of some tests. A guide is included in the kit, which outlines each test, providing step-by-step instructions and offers an interpretation of typical results (USDA 1999).
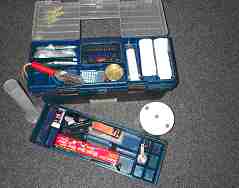
Figure 1. USDA soil quality test kit
Field trials
During the spring of 2002, the AESA Soil Quality Program collaborated with AESA regional and municipal conservation field staff to test the kit in three different areas of Alberta. It was tested at the three locations in cooperation with the Cypress Forty Mile ASB Partnership in the Foremost area, the Rainy Creek Soil Conservation Club in Bentley, and the DeBolt Area Dirt Savers in DeBolt. The kit was used to compare the effects of different management systems on soil quality in various soil types. The locations chosen for the study incorporated a variety of management systems on the same soil. At each location, variations of conventional till (CT), no-till (NT) and forage cropping systems were evaluated. At Foremost, the management systems investigated were native rangeland (Range), CT wheat/fallow rotation and continuous cropping NT. At Bentley the treatments were pasture, no-till after previously conventionally tilled (NT/CT), no-till after previous forages (NT/F) and CT. At DeBolt, long term CT, conventional tillage after previous forages (CT/F) and forages after previously conventionally tilled soil (F/CT) were examined. Although not always possible, fields were selected which had been managed in the existing system for more than two years. This was done to ensure that effects from the existing system were adequately expressed.
Evaluations took place during the early growing season at the three locations across Alberta in 2002 (Foremost-April 30, Bentley-May 13, DeBolt-May 28). Sampling occurred before cultivation/seeding at the Foremost and Bentley sites, with the exception of the Bentley NT/CT field, which was seeded into a winter cereal. Seeding had already taken place at the DeBolt site. Soil samples were taken from the upper slope position, away from headlands and in an area representative of the entire field. Samples were taken from the inter-row area where applicable and obvious field implement tire tracks were avoided. Three replicates of all tests were performed in each management system and location. The soil sampling positions within each management system were selected at random but within a few meters of each other. The site characteristics of Foremost, Bentley and DeBolt were described (Appendices 1, 2 and 3) and used to interpret certain results.
Field methodology
Each test was conducted based on instructions given in the test kit manual (USDA 1999). Within each sampling area, three aluminum rings (12.7 cm high by 14.9 cm inner diameter) were installed to a depth of 7.5 cm, to measure infiltration and soil respiration. Adjacent to the ring, a thermometer was used to read the soil temperature at a depth of 2.5 cm. Three samples of loose soil were collected from the area surrounding the rings to a depth of 15 cm. This soil was used to determine pH, electrical conductivity, soil nitrate content and aggregate stability.
Infiltration was determined by adding water, equivalent to 2.5 cm depth, to the aluminum rings and recording the amount of time needed for the water to fully penetrate the soil (Figure 2). The test was performed twice. The first amount of water wetted the soil so the management systems had more equal soil water contents. The second inch of water gave a more representative rate of infiltration and was used as the reported value.
Figure 2. Infiltration test
Bulk density was measured within a meter of the aluminum rings. A bulk density ring 7.5 cm in diameter was driven into the soil to a depth of approximately 7.5 cm. The depth of the ring was measured to determine the exact soil volume taken. It was then carefully removed to avoid losing any soil and the excess soil on the bottom of the ring was removed (Figure 3). The resulting sample was weighed, dried in an oven at 105 C for 24 hours, and then weighed again to determine its dry weight. The dry weight was then divided by the soil volume to calculate the bulk density. Gravimetric soil water content was estimated from the oven dried bulk density sample.
Figure 3. Bulk density measurement
Earthworm concentration in the soil was estimated by digging a pit 30 cm� in dimension (Figure 4). The soil removed from the pit was sorted and the number of earthworms was recorded. A solution of mustard powder and water was then poured into the pit to draw out any other worms.
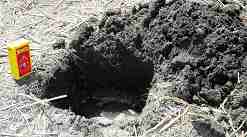
Figure 4. Earthworm concentration measurement
Soil respiration was determined 12 hours after wetting the soil during the infiltration test. Respiration was measured from the headspace of the rings, which were capped with a lid. Respiration was estimated colorimetrically by passing the headspace gas through an open CO2 detection tube (Dr�ger, Germany) 30 minutes after capping of the ring (Figure 5).
Figure 5. Respiration measurement
Electrical conductivity (EC) and soil pH were estimated from the topmost portion of a 1:1 soil to water solution. The solution was first mixed by vigorous shaking. EC was measured using a calibrated DiST WP 4 pocket meter (Hanna Instruments, Woonsocket, RI.). The solution was then allowed to settle for ten minutes before pH was tested using a calibrated pHep 3 meter (Hanna Instruments, Woonsocket, RI.) (Figure 6).
Figure 6. Electrical conductivity and pH measurement
Immediately following the pH test, the solution was passed through filter paper for nitrate determination. Soil nitrate concentration of the filtrate was estimated colorimetrically using AquaChek Nitrate/Nitrite water quality test strips (Environmental Test Systems, Elkhart, IN) (Figure 7). The test kit provides two measurements of nitrates, estimated and exact nitrate concentration. Calculation of exact NO3-N takes into consideration the volume of water and weight of soil used, while the estimated NO3-N calculation does not. By including the volume of water and weight of soil used, a more precise measurement of nitrate concentration can be achieved.
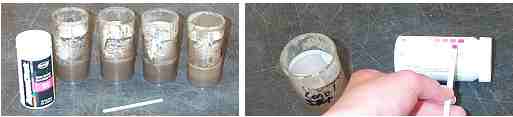
Figure 7. Nitrate determination
Aggregate stability was determined by subjecting 10 g of sieved, air-dried soil to the forces of flowing water. The soil sample was slowly wetted and then exposed to up and down oscillations in distilled water (Figure 8). The remaining water stable aggregates were dried and weighed, then were dispersed in a Calgon solution. The dispersion removed all the silt and clay aggregates, leaving the sand portion of the soil. This sand portion which remained after the dispersion was dried, then weighed and used to determine the percent of soil >0.25 mm in size.

Figure 8. Aggregate stability
Depth to resistance layer was conducted by using a metal rod (coat hanger) to probe the soil from the surface (Figure 9). When resistance on the rod was encountered indicating a compaction layer, the depth of soil where the rod stopped was measured.
Figure 9. Depth to resistance layer
Complete analysis of the samples (9-12 samples) from each site (Foremost, Bentley or DeBolt) took place over a two-day period and was performed by two to three people. Infiltration rate test, bulk density sampling, earthworm observation and soil physical observations were completed during a five hour period on the first day. During the second day, the soil respiration, pH, EC, nitrate and aggregate stability tests were conducted. The soil sub-sample collected from each site must be air dry before it can be analyzed for pH, EC and aggregate stability on the second day.
Standard laboratory procedures
Within each management system, three soil samples were randomly collected from the 0-15 cm depth. The sample was split into two sub-samples, which were used for standard laboratory analysis and for analysis using the field test kit. Comparisons were made between the soil test kit and standard laboratory analyses for a subset of soil quality indicators, which included pH, EC and soil nitrate content. The soil samples were additionally analyzed for fertility, total organic carbon, and texture by laboratory methods (Table 1).
In the lab, soil pH was determined using a 1:2 soil to water ratio and electrical conductivity was measured with a saturated paste extract method (McKeague 1978). An automated cadmium reduction method was used to measure soil nitrate content (APHA 1998).
Statistical analyses
Statistical analyses were performed on results from the soil analyses of the 0-15 cm depth. Using SAS (1999), least squares means (LSM) at P � 0.05 was applied to determine statistical differences between management systems at each of the three sample sites across the province.
In order to determine if the test kit analyses correlated well with the analyses performed by the laboratory, the data was compared using a paired comparisons t-test at P � 0.05.
Results and Discussion
Infiltration rate
Infiltration rate or the rate of water entry into the soil is sensitive to near surface soil conditions and is subject to significant changes with soil use and management. The determination of infiltration rate is important for determining if water will either be available for plant use or become runoff and cause erosion. A significant difference between infiltration rates was not found at any site (Table 2). The infiltration rates were classified as moderately slow (<0.5 in/hr) to very rapid (>20 in/hr) according to the soil quality test kit guide (USDA 1999). Tillage reduces soil aggregation, creating the potential for compaction, surface crusting and the loss of open pores, which can all lead to erosion. We might expect forages and no-tillage systems to have the highest infiltration rates due to increased aggregation and undisturbed pore space. The results indicate that no-till and forage systems positively influence infiltration, although the rangeland at Foremost and the pasture site at Bentley had a much slower infiltration rate than we would expect. The pasture at Bentley was situated on a discharge area, which caused the lower infiltration rate, while the cause of the Foremost situation may be attributed to a higher bulk density or perhaps due to overgrazing which reduces plant rooting capacity and therefore surface pore channels and aggregation.
Table 1. Results from standard laboratory analysis of soil samples (0-15 cm) collected from three sampling sites
Site |
| Foremost | Bentley | DeBolt |  | |
| Management | CT | NT | Range | CT | NT/CT | NT/F | Pasture | CT | CT/F | F/CT |
| Available Nutrients (lbs/ac) | | | | | | | | | | |
| Nitrate-N | 14 | 11 | 29 | 8 | 13 | 8 | 29 | 53 | 34 | 3 |
| Ammonium-N | 4 | 4.8 | 4.8 | 1 | 3 | 1 | 2 | 40 | 14 | 2 |
| Phosphorus | 17 | 43 | 22 | 11 | 74 | 99 | 130 | 35 | 25 | 60 |
| Potassium | 711 | 751 | 674 | 356 | 276 | 568 | 2888 | 462 | 245 | 497 |
| Sulphate-S | 4 | 2 | 4 | 11 | 19 | 17 | 56 | 13 | 30 | 11 |
| Organic Matter (%) | 1.9 | 2.2 | 3.1 | 4.5 | 3.1 | 3.8 | 12.6 | 3.5 | 2.9 | 4.2 |
| Texture | Loam | Clay Loam | Loam | Loam | Loam | Loam | Sandy Loam | Silt Loam | Silt Loam | Loam |
| Sand (%) | 37 | 36 | 49 | 33 | 43 | 41 | 56 | 26 | 25 | 33 |
| Silt (%) | 36 | 37 | 32 | 44 | 31 | 41 | 30 | 58 | 57 | 47 |
| Clay (%) | 27 | 28 | 19 | 23 | 26 | 19 | 14 | 16 | 18 | 20 |
Table 2. Means for soil quality test kit indicators by site and management system
| Site |
Foremost | Bentley | DeBolt |
| Management | CT | NT | Range | CT | NT/
CT | NT/F | Pasture | CT | CT/F | F/CT |
| Soil Respiration (lbs CO2-C/acre/day) | 7.9 | 10.9 | 12.5 | 7.8 | 8.2 | 8.2 | 8.0 | 20.4 | 14.3 | 8.3 |
| Soil Water Content (% Volume) | 15a# | 16a | 12b | 26b | 18c | 24bc | 58a | 29a | 21b | 28a |
| Bulk Density (g/cm�) | 0.82 | 1.20 | 1.40 | 1.12b | 1.10b | 1.30a | 0.59c | 1.14 | 1.14 | 1.24 |
| Electrical Conductivity (dS/m) | 0.12a | 0.07b | 0.13a | 0.06b | 0.1b | 0.09b | 0.3a | 0.18 | 0.13 | 0.03 |
| pH | 7.8a | 6.5b | 7.4a | 5.7c | 5.5c | 6.0b | 8.0a | 5.5b | 4.9c | 6.1a |
| Estimated Soil NO3-N (lb/ac) | 1.4a | 1.5b | 6.7b | 2.7bc | 4.5a | 3.7ab | 2.1c | 29.0 | 7.5 | 1.2 |
| Exact Soil NO3-N (lb/ac) | 1.8a | 2.0b | 9.8b | 3.5 | 5.9 | 4.6 | 5.3 | 52.0 | 12.4 | 2.0 |
| Infiltration Rate (in/hr) | 3.6 | 2.2 | 1.1 | 8.1 | 21.2 | 13.3 | 1.9 | <0.5 | 2.8 | 1.8 |
| Depth to Resistance Layer (cm) | 11 | 15 | 21 | 12b | 15a | 10c | 10c | 11 | 11 | 7 |
| Earthworms Observed | 0 | 0 | 0 | 0 | 0.3 | 4.5 | 0 | 0 | 0 | 0 |
Water Stable Aggregates
(% of soil > 0.25 m) | 24 | 39 | 45 | 52b | 48b | 49b | 88a | 32b | 28b | 47a |
# within site and management for each indicator, the means followed by different letters are significantly different at P � 0.05. Where no letter is indicated, there was no significant difference between the management systems for that particular soil indicator tested with the soil quality test kit.
Bulk density
Bulk density is a dynamic property, which varies with particle density (sand, silt, clay and organic matter) and the structural makeup of a soil. It affects air and water movement and root development throughout the soil and is an indication of compaction, soil structure, texture, organic matter content and erosion potential. The only significant differences in bulk density were between management systems at the Bentley site (Table 2). With the exception of the CT soil at Foremost and the pasture soil at Bentley, bulk densities across all three sites were determined to be within the range of 1.0 to 1.7 g/cm3, which indicate good conditions for root growth in the upper 7.5 cm of soil. The CT soil at Foremost, most likely had a lower bulk density due to recent annual cultivation and the low measurement on the pasture soil at Bentley was due to a thick thatch layer that was included with the sample as directed by the test kit instruction manual. This is similar to Wilkins and Heideman (2000), who suggested that this method is not an accurate reflection of bulk density because of the duff layer on top and recommended an alternative to resolve the problem by sampling 2 inches below the surface.
Earthworms
Earthworms represent soil biodiversity and are responsible for nutrient cycling, increasing aggregation and porosity as well as suppressing certain pests and disease organisms. Very few earthworms were found during this study (Table 2). The NT/F and NT/CT systems at Bentley were the only systems where earthworms were located. Generally, earthworms are more common in undisturbed systems. Soil temperature, soil properties, food source and soil disturbance have an effect on earthworm populations. Unfavourable conditions may have influenced our findings or perhaps earthworms were never introduced to the area.
Soil respiration
Biological activity is seen as a positive attribute of soil quality as it is a direct reflection of nutrient turnover and the breakdown of organic matter. CO2 respiration is a product of biological activity. The soil quality test kit was not able to detect any significant differences in soil respiration rate between the various management systems (Table 2). Across the three sites, respiration rates ranged from very low (7.8 lbs CO2/acre/day) to medium soil activity (20.4 lbs CO2/acre/day) based on interpretations in the soil quality test kit guide (USDA 1999). Soil respiration is highly variable both spatially and seasonally. It is strongly influenced by soil temperature and moisture and, to a lesser degree by pH, oxygen availability and type of organic material. Soil temperatures at the time of sampling varied with management system. Foremost had a range from 4.1 C to 12.9 C (CT<NT< Range). Soil temperatures at Bentley were 6.4 C to 10.2 C (pasture<CT<NT/F<NT/CT). At DeBolt, soil temperatures were higher, ranging from 11 C to 13 C (F/CT<CT<CT/F). Low temperature and moisture conditions may have had an affect on the respiration results although the respiration data does not indicate a correlation between soil temperature and moisture.
The AESA Soil Quality Program is uncertain of the reliability of the results from this method of respiration measurement. According to interpretations of results given in the test kit guide (USDA 1999), nine of ten soils we measured were classed as very low to moderately low in soil activity. These classifications suggest that the soil is very or somewhat depleted of available organic matter or has little to low biological activity. It is unlikely that these soils were in such a condition. Although temperature and moisture may have affected respiration rates at these sites, subsequent measurements completed in central Alberta were performed in optimum moisture and temperature conditions and similar improbable results were once again obtained. Perhaps the interpretations need to be adapted to Alberta conditions or further work needs to be done to refine the current method of measurement.
Electrical conductivity
Electrical conductivity was statistically different between management systems at both Foremost and Bentley (Table 2). The highest EC value was observed in the permanent pasture site at Bentley. This may have been a result of the high water table as this is a discharge site. The cause of the EC values at Foremost is unknown. Although differences were detected, all of the samples were determined to have EC values below 2.0 dS/m and would not be expected to affect general crop growth.
pH
pH is largely affected by temperature and precipitation and affects the availability of plant nutrients, mineral solubility and microorganism activity. Soil pH was significantly different between management systems at all locations (Table 2). pH in the NT system at Foremost was the lowest at 6.5, the CT soil was 7.8 and the rangeland system had a pH of 7.4. At the Bentley site, the permanent pasture system had a value of 8.0, which is considered moderately alkaline, while the annual cropping systems were considered moderately acid. Plant growth may be slightly affected at the Bentley sites depending on the crop grown. pH values at DeBolt ranged from 4.9 in the CT/F system to 6.1 in the F/CT system. Generally, pH values between the ranges of 6 and 7.5 are considered optimum for plant growth. Interpretations of soil quality at a specific site depend on the land use and crop tolerance to pH.
Soil nitrate
Significant differences in estimated and exact soil nitrate content between management systems were found using the test kit (Table 2). The method for estimating nitrate content revealed differences at Foremost and Bentley, while differences between exact soil nitrate content were found only at the Foremost site. The estimated values were consistently lower than the exact soil NO3-N contents as measured by the soil quality kit. Calculation of the exact nitrate considers the volume of water used in the test, which most likely reduces the resulting value. Marginal to optimum nitrate-N values are considered to be about 30-85 lb/ac from the 0-15 cm soil depth (Laverty et al. 1988). All values measured were considered low (1.8-12.4 lb/ac), with the exception of the CT system at DeBolt, which had a value of 52 lb/ac. This value may be a result of the effects of spring fertilization at this site.
The amount of residual nitrate-N in the soil is a function of the rate at which microorganisms decompose soil organic matter, through the process of nitrification. The data indicated a possible correlation between soil respiration rate and exact nitrate-N. The systems that contained the highest nitrate-N content also produced the highest soil respiration rate.
Aggregate stability
Aggregate stability is a measure of the percentage of water stable aggregates that resist the forces of flowing water. The stability of soil aggregates directly affects water and air movement, soil crusting, erosion potential, and is reflected by soil organic matter content. As described in the test kit interpretation guide, the assessment of aggregate stability is based on clay and organic matter content. Based on these characteristics, a suitable range of aggregate stability for the soils at Foremost would be 69-76%, 69-86% at Bentley and 67-77% at DeBolt (USDA 1999).
A significant difference in aggregate stability between management systems was not found at Foremost where the native rangeland soil had 6% greater aggregation than the NT and 21% more than the CT soil (Table 2). Aggregate stability at Bentley ranged from 48% in the NT/CT to 88% in the permanent pasture soils (Table 2). At DeBolt, stability ranged from 28% in the CT/F to 47% in the forage system.
The results show that the aggregate stabilities are lower than suitable in all the management systems analyzed with the exception of the permanent pasture site at Bentley (Table 2). The lower than expected result in the rangeland soil at Foremost may be attributed to high sand content which greatly reduces aggregation. In general, the greater the aggregation of a soil, the less erodible the soil will be. These low results highlight the possibility of erosion if all of the soils are not protected with plant cover or residue. Although the results were much lower than expected, they do follow a trend whereby soils supporting forage systems have a greater ability to withstand the forces of flowing water due to increased organic matter content.
Depth to resistance layer
Compaction layers may develop from a plough layer, tillage when the soil is too wet or excessive traffic in an area. These layers can limit air and water movement within the soil and can impede root growth, all which affect yield and soil quality. The depth to resistance reflects individual soil profile characteristics such as soil moisture status or the existence of a Bnt layer (sodium and clay accumulation zone). The depths measured at all of the sites were within the traditional cultivation zone (up to 23 cm deep) and didn't correlate with organic matter content or soil water content as might be anticipated.
A significant difference between depth to the resistance layer was found between management systems at the Bentley site (Table 2). The results indicate that both the NT/F and the permanent pasture systems had a resistance layer at the 10 cm depth. While the CT and NT/CT soil had significantly lower resistance layers at 12 cm and 15 cm depths respectively. This may be due to drier soil conditions under pasture and denser conditions under the NT, both of which increase penetration resistance.
This method of measuring compaction is subjective and depends on the exertion of strength used when inserting the rod into the soil. The results are valuable for interpreting results from other tests but the repeatability of this method is questionable.
Soil water content
Soil water contents under different management systems were found to be statistically different at all three sites (Table 2). In the Foremost soils, moisture ranged from 12% in the rangeland to 16% in the NT system. The Bentley soils had a wider variation with the pasture soil being 3.2 times moister than the NT/CT system. The pasture system at the Bentley site was situated on a discharge area, which may have contributed to the high result, while low moisture content of the NT/CT system was caused by an actively growing crop at the time of sampling. At the DeBolt site, the CT/F system had the lowest moisture content, while the long-term CT soils were the moistest. While significant differences were found, no one management system consistently had a higher soil moisture level across the three sites evaluated.
Comparison of soil quality test kit vs. standard lab analysis
Means of three soil quality indicators measured by the soil quality test kit and by standard laboratory analysis are given in Table 3. Significant differences were detected between the two methods of analysis for all three indicators. The test kit yielded values significantly lower than those produced using standard laboratory methods. Evanylo and McGuinn (2000) also found that the test kit produced lower Nitrate-N results than standard analysis but were dissatisfied with the performance of the test kit pH meter, which consistently yielded results 0.5 to 1.0 units higher than with standard analysis. In contrast, the test kit trial completed by Liebig et al. (1996) indicated no differences in pH or nitrate determination between the test kit and standard analysis but found a difference in EC, which was attributed to spatial differences in sampling.
Although differences were determined between analyses, interpretation of the results from both methods leads to similar conclusions. This indicates that the test kit is able to measure and assess these three indicators for the purposes of monitoring soil quality and identifying problem areas in a field.
Table 3. Means for three soil quality indicators as measured by the soil quality test kit and standard laboratory analyses
| Soil Quality Indicator | Mean |
Soil Quality Test Kit | Standard Laboratory Analysis |
| pH | 6.3b# | 6.6a |
| Electrical Conductivity (dS/m) | 0.12b | 0.44a |
| Nitrate NO3 – N (lb/ac) | 9.9b | 20.0a |
# means for each evaluation method, followed by different letters are significantly different at P � 0.05.
Significant differences may be attributed to the method of analysis. The soil quality test kit uses a 1:1 soil to water solution for pH, EC and nitrate determination. Standard laboratory analysis uses a saturated paste method for nitrate determination and utilizes a 2:1 soil to water ratio for pH and EC. The standard lab method for measuring EC requires the soil:water mixture to sit longer than the test kit method so a higher EC would be expected. The test kit method of soil nitrate determination is a simple colorimetric system, which approximates nitrate/nitrite content.
Test kit critique
Results from this investigation showed that the test kit is able to detect differences between management systems, although no consistent patterns on the effect of management system were evident other than the positive effect of forages on aggregation. Significant differences were found in all soil indicators measured with the exception of soil respiration and infiltration rate. Significant differences were found between management systems for seven indicators at Bentley opposed to five at Foremost and four at DeBolt. The ability of the kit to distinguish differences between management system makes it an excellent method to show trends as a result of soil management, a similar conclusion also described by Evanylo and McGuinn (2000), Hubbs et al. (2000), Seybold et al. (2001) and Seybold et al. (2002).
The tests included in the kit are easily performed and interpreted which makes it suitable for educating producers and consultants on selection of appropriate management practices. The soil quality test kit is also a good farm-based tool, which provides results more rapidly than standard lab analyses; an observation also made by Evanylo and McGuinn (2000).
Perhaps the most valuable function of the test kit is its ability to perform in situ tests such as respiration, infiltration, bulk density, penetration resistance and earthworm concentration, which cannot be performed in a laboratory. This allows the user to measure a suite of physical, chemical and biological soil properties, which are essential to fully evaluate soil function. The test kit results for pH, EC and nitrate content also compared well to the results from standard laboratory analysis, which demonstrates the ability of the test kit to provide reliable measures of the selected soil quality indicators, a conclusion also stated by Liebig et al. (1996).
Completion of the full suite of tests takes a portion of two days because of a required 16-24 hour waiting period for the respiration and aggregate stability measurements. It is recommended that three replications of each test are performed at a test site in order to ensure variability is accounted for. The amount of time required to perform the tests in the kit as well as the cost of the test kit, which is $500.00 (US) may discourage producers from using this tool. The test kit also does not provide follow-up information about what should be done if the results from the test kit are unfavourable. The user is responsible for seeking out possible remediation measures to improve his or her soil quality.
Soil organic matter is very important as it influences aggregation, erosion, compaction, water holding capacity, infiltration, nutrient supply and carbon sequestration among many others. The test kit often makes use of organic matter content information for the interpretation of results from the kit. However, no test for organic matter is included with the kit. The AESA Soil Quality Program is currently testing two field methods for the assessment of soil organic matter, in order to determine if they would compliment the USDA soil quality test kit (Weil et al 2003; Bowman 1997).
Conclusion
Soil quality is how well a soil functions for its intended use. The assessment of soil quality is important to determine the sustainability of current land and soil management systems. Soil quality evaluation is a tool to monitor changes in soil properties caused by external factors such as management and climate.
The USDA-ARS soil quality test kit is a quantitative tool that enables assessment in a field setting. It was developed to encourage producers and agricultural consultants to routinely measure soil quality and make management decisions based on the results. The kit integrates indicators of physical, chemical and biological soil properties into eleven field tests that evaluate the level of soil function. The tests are designed to provide quick results for diagnosing possible soil health problems, comparing management systems and as a measure of sustainability by monitoring soil quality over time.
The AESA Soil Quality Program tested this kit in a variety of management systems at three sites across Alberta. The objectives of the study were to determine if the kit was easy to use and interpret, if the kit was sensitive to differences due to management and to determine the accuracy of the results against those obtained through standard lab analyses.
Results from this investigation indicate that the kit is sensitive to management as it was able to detect significant differences between management systems in eight of eleven soil indicators. Statistically significant differences were identified in soil water content, bulk density, electrical conductivity, pH, estimated soil nitrate levels, exact soil nitrate levels, depth to resistance layer and water stable aggregation in one or more of the three sites. Only one consistent relationship between management systems and indicators emerged, which suggested that forages increase aggregation. The kit is useful for characterizing soil quality in the field and comparing relative changes in soil properties but site characteristics must be known in order to interpret some of the results.
Although the test kit consistently yielded results lower than those from standard lab analysis for pH, EC and nitrate content, the interpretation of the results is similar. This indicates that the kit is able to provide measurements for the purpose of monitoring soil quality and identifying problem areas in a field.
The test kit was easy to use in the field, as each step of the procedures are described in detail in the guide provided with the kit. The results interpretation section of the guide provides the user with some indication of where problems may exist in the field but does not provide any management related solutions. Despite the lack of a test for organic matter and the purchase cost, the kit is a valuable tool to measure important dynamic soil properties that can only be measured in situ. It gives land managers the opportunity to become more familiar with the health of their soils and provides them with relatively quick results, which may lead to improved management decisions in the future. More importantly, the USDA-ARS soil quality test kit is an awareness tool with the potential to help advance environmentally sustainable agriculture in Alberta.
Literature Cited
American Public Health Association. 1998. Standard Methods for the Examination of Water and Wastewater, 20th ed. Washington, D.C. 1220 pp.
Bowman, R.A. 1997. Field Methods to Estimate Soil Organic Matter. Conservation Tillage Fact Sheet #5. USDA-ARS and USDA-NRCS. Akron, CO.
Doran, J.W. and Parkin, T.B. 1994. Defining and Assessing Soil Quality. Doran, J.W., Coleman, D.C., Bezdicek, D.F. and Stewart, B.A. (eds.). In: Defining Soil Quality for a Sustainable Environment. SSSA Special Publication Number 35. Soil Science Society of America, Inc. and American Society of Agronomy, Inc. Madison, Wisconsin, USA. pp. 3- 22.
Evanylo, G. and McGuinn, R. 2000. Agricultural Management Practices And Soil Quality: Measuring, assessing, and comparing laboratory and field test kit indicators of soil quality attributes. Virginia Cooperative Extension Publication Number 452-400. Web page, accessed 28 January, 2003.
Hubbs, M.D., Seybold, C.A. and Tyler, D.D. 2000. Effects Of Cotton Tillage Systems On Soil Quality Using On-Farm Tests. Proceedings of the Beltwide Cotton Conference 1:45-47. National Cotton Council, Memphis, TN.
Karlen, D.L., Mausbach, M.J., Doran, J.W., Cline, R.G., Harris, R.E. and Schuman, G.E. 1997. Soil Quality: a concept, definition and framework for evaluation. Soil Science Society of America Journal 61:4-10.
Laverty, D., Ashworth, J., Nyborg, M., Harapiak, J., Kucey, R., and Kryzanowski, L. 1988. Soil Test Recommendations for Alberta. Technical Manual. Agricultural Soils and Animal Nutrition Laboratory, Edmonton, AB. 49 pp.
Liebig, M.A., Doran, J.W., and Gardner, J.C. 1996. Evaluation of a Field Test Kit for Measuring Selected Soil Quality Indicators. Agronomy Journal 88:683-686.
McKeague, J.A. (ed). 1978. Manual on soil sampling and methods of analysis. Second edition. Subcommittee on Methods of Analysis. Canadian Soil Survey Committee. Canadian Society of Soil Science. Ottawa, Ont. 212 pp.
SAS Institute Inc. 1999. SAS Version 8. SAS Institute Inc., Cary, NC.
Seybold, C.A., Dick, R.P. and Pierce, F.J. 2001. USDA Soil Quality Test Kit: Approaches for Comparative Assessments. Soil Survey Horizons 42:43-52.
Seybold, C.A., Hubbs, M.D. and Tyler, D.D. 2002. On-Farm Tests Indicate Effects of Long- Term Tillage Systems on Soil Quality. Journal of Sustainable Agriculture 19(4):61-73.
United States Department of Agriculture. 1999. Soil Quality Test Kit Guide. United States Department of Agriculture, Agricultural Research Service and Natural Resources Conservation Service-Soil Quality Institute. Web page, accessed 28 January, 2003. (reference: soils.usda.gov/sqi/kit2.html)
United States Department of Agriculture. 2001a. Soil Quality-Introduction. Soil Quality Information Sheet. United States Department of Agriculture, Natural Resources Conservation Service-Soil Quality Institute. Web page, accessed 28 January, 2003. (reference: soils.usda.gov/sqi/files/sq_one_1.pdf)
United States Department of Agriculture. 2001b. What is Soil Quality? United States Department of Agriculture, Natural Resources Conservation Service-Soil Quality Institute.Web page, accessed 16 October, 2003. (reference: soils.usda.gov/sqi/soil_quality/what_is/index.html#What)
Warkentin, B.P. 1995. The changing concept of soil quality. Journal of Soil and Water Conservation 50:226-228.
Weil, R.R., Islam, K.R., Stine, M.A., Gruver, J.B. and Sampson-Liebig, S.E. 2003. Estimating active carbon for soil quality assessment: A simplified method for laboratory and field use. American Journal of Alternative Agriculture 18(1):3-17.
Wilkins, D.E. and Heideman, E. 2000. Bridging The Gap Between Education And Research Through Soil Quality Testing. 2000 Columbia Basin Agricultural Research Annual Report. Special Report 1012. Oregon State University and USDA-Agricultural Research Service, Pendleton, Oregon. pp. 94-100.
Acknowledgements
The authors would like to thank the following people for their assistance with this project:
Foremost
Brian Hildebrand- Co-operator
Gayle Ivanics- Cypress Forty Mile ASB Partnership Conservation Agronomist
Cypress Forty Mile ASB Partnership
Bentley
Harvey Brink- Co-operator
Dave Carlyle- Co-operator
Rainy Creek Soil Conservation Club
Monica Bryan- County of Red Deer Conservation Technician
Shayne Steffan - Assistant Manager Agricultural Services-County of Lacombe
Annette Svederus - AESA Regional Conservation Coordinator -Central Region
Sandra Taillieu -Pulse Specialist, Alberta Agriculture, Food and Rural Development
Rick Taillieu - Agronomist, Alberta Reduced Tillage Linkages
Russ Horvey - Beef and Forage Specialist, Alberta Agriculture, Food and Rural Development
Jim Broatch - Cereal and Oilseed Specialist, Alberta Agriculture, Food and Rural Development
DeBolt
Ken Reiger- Co-operator
DeBolt Area Dirt Savers
Norm Boulet- Agricultural Fieldman M.D. of Greenview
John Zylstra - AESA Regional Conservation Coordinator- Peace Region
Norwest Labs - Edmonton
Prepared by:
J.L. Winder, K.R. Cannon and T.W. Goddard
Alberta Agriculture, Food and Rural Development
Conservation and Development Branch |
|