| | RTW This Week has created a weekly feature of weather station data available from Alberta Agriculture and Rural Development (ARD). Ralph Wright from ARD's Agro-Meteorological Applications and Modelling Unit provides the near real time station data maps of the Province.
.
October 25, 2010 Update
As of October 17, 2010, looking back over the past year, precipitation accumulations across the Peace Region are well below normal. The central Peace is extremely dry with accumulations like this seen less than three times over the past 50 years. In fact, of the 16 climate stations that Agriculture and Rural Development operates in the Peace Region, nine are at or near record dry, looking as far back as 1961. However, Alberta's climate patterns are very unpredictable and abrupt changes from dry cycles to wet cycles and, vise versa, tend to be the norm, with 2010 serving as the most recent example across most of the south-half of the province.
Following this year’s spring snow melt, by April 4, 2010, 365-day precipitation deficits were at or below 1-in-25 year lows across most of the Province, north of the TransCanada Hwy. With the onset of spring, weather patterns abruptly changed with most areas south of Hwy 16 and east of Hwy 2, seeing well above normal precipitation accumulations. In fact in many areas, fears of it being too dry changed to worries that it would be too wet, with southern Alberta seeing massive flooding events. This marked the beginning of a major turnaround for these formerly dry areas, with some areas in the central parts of the province swinging from 1-in-25 year lows, to 1-in-6 or even 1-in-12 year highs in the span of a few months.
Looking back over 50 years, there are many examples of abrupt turnarounds and large wet and dry areas, occurring within close proximity of one another. For example, 1997 was a wet year across the Peace Region with much of the northern and western parts of the region seeing 1-in-25 year wet period. In contrast, the following year (1998) was very dry, seeing at least 1-in-12 year precipitation deficits across most of the region, followed by another dry year in 1999. However, 2000 saw significant moisture return to the area, with some parts of the central region experiencing a 1-in-25 year wet period. The lessons from the past show that the only predictable thing about Alberta’s weather is that it is unpredictable. Dry spells can, and often will, start and end without warning.
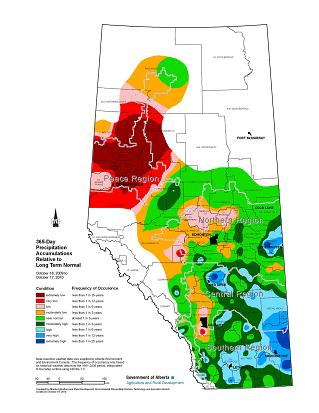
Click on the map for larger image of 365-Day Precipitation Relative to Normal as of October 17, 2010 - 251K
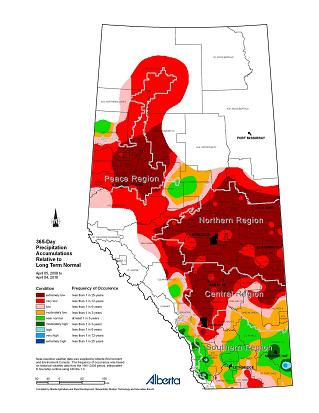
Click on the map for larger image of 365-Day Precipitation to Normal as of April 2, 2010 - 232K
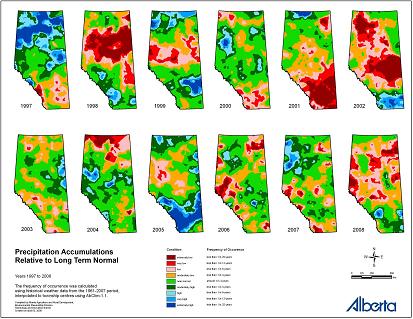
Click on the map for larger image of Yearly Precipitation Patterns 1997 to 2008 - 319K
AgroClimatic Information Services (ACIS) has more weather, climate and related agriculture features to help with long-term planning and decision-making throughout the year. To view real time station data and maps, click here.
For more information, contact:
Ralph Wright
Agro-Meteorological Applications and Modelling Unit
Alberta Agriculture and Rural Development
Ph: 780-427-3556
Email: ralph.wright@gov.ab.ca |
|