| | Appendix A | Appendix B | Appendix C | Appendix D
Appendix A: Detailed Methodology
Site preparation
Preparation of the test site at the Matejka farm near Red Deer, Alberta began during the week prior to February 14, 1997. Snowmaking was attempted on the 14th , but warm weather prevented the trial from proceeding. A second site was selected at the Giebelhaus farm near Vegreville, Alberta. Site preparation consisted of outlining a 15 m x 15 m plot using standard square hay bales, and lining it with an impermeable geotextile liner. The plot was positioned so that the natural slope of the ground would direct meltwater toward the outlet. The outlet was equipped with an H-flume apparatus to facilitate runoff sampling, and enabled the use of a float activated data logger to monitor meltwater discharge.
Snowmaking began on the evening of February 26, and processed approximately 283,875 litres of raw liquid hog manure before shutting down on the morning of February 28. Raw liquid manure was pumped directly from the lagoon by cutting a hole in the surface ice and suspending a supply pump in the top layers of the lagoon. By taking the raw water from the surface of the unagitated lagoon, the manure used for the trial contained almost no solids. This may have made the raw water unrepresentative of typical hog manure solids content, but was unavoidable in the absence of proper equipment to agitate and homogenize the lagoon mixture.
Climatic conditions during snowmaking
From previous work with Snowfluent (Wuite, et al 1997), it was determined that under the ambient conditions of relative humidity (85% to 99% during the actual trial), a maximum temperature of -6 C could be tolerated and still produce snow of a satisfactory condition. The period of the trial happened to correspond with one of the few warm spells of the winter of 1996/97, seeing temperatures rise to around 0C. This forced the snowmaking operation to restrict its activities to the hours of approximately 9:00 pm to 6:00 am. During this time interval, the mean temperature and humidity were around -12C and 93% respectively. Snowmaking staff monitored the temperature throughout the night, and were able to discontinue snowmaking when temperatures rose above the -6C threshold.
Sampling
Samples of the various components and phases of the Snowfluent process were planned around the schedule outlined in Table A-1, and analysed for the parameters listed in Table A-2. Compliance with the schedule was flexible in order to accommodate the unpredictability of the melt season.
Water samples
Each water sample was collected in two 2 litre glass bottles for chemical analysis, and one 1 L Nalgene bottle for microbiological analysis.
Sample of raw manure were taken from a shunt valve on the portable Snowfluent plant at various times during the snowmaking period.
Grab samples of snowmelt runoff were collected at the H-flume outfall. After the complete melting of the snowpack, grab samples were taken of the residual standing water on the plot prior to dismantling the field site.
Where necessary, the water chemistry lab at ARC Vegreville inoculated the samples with microorganisms. This was done to insure that any decrease in the BOD levels from stage to stage of the Snowfluent process, represented a true drop in oxidizable compounds, and not just a reduced rate of biological oxidation due to sterilization.
Snow samples
All snow samples were collected using one 1 litre Nalgene bottle for microbiological analysis, and two to four 2 litre plastic bags for chemical analysis, depending on the volume of water required by the lab.
Samples of the new snow were collected by placing a lined, 50 cm x 50 cm x 10 cm tray beneath the plume of falling snow. Once the tray was full, snow was transferred to the appropriate sample container using a stainless steel scoop.
Samples of the aging snowpack were taken at three different depths, and at two different locations on the plot. The bottom two depths were calculated as 20% and 50% of the initial total depth of the pack and remained fixed over time with respect to elevation above ground. Initially, these depths were sampled by removing three 2.0 m horizontal cores taken at each depth. As the pack matured, the lower depths became increasingly icy, preventing the insertion of the corer. This necessitated a switch to a hand auger. The top-most depth was sampled in a 0.3 m x 0.3 m quadrant on the top of the pack. The top 7-10 cm of cover was removed, and the snow was sampled at approximately one foot below the surface using a stainless steel scoop. This sample depth followed the surface of the snow pack, and migrated down as the pack melted, eventually excluding the lower sample depths.
Controls using distilled water in the tray liners and plastic bags were submitted for analysis.
Bioaerosols
Airborne bacteria were sampled during snowmaking by the ARC Vegreville microbiology staff, using a pump/impinger apparatus to sample 100 litres of air for each sample. Four points were sampled along the line of wind direction, with two samples collected at each point. One was downwind of the snowgun at a distance deemed to be out of the snow plume, approximately 100 m. Two sampling locations were directly in the snow plume at distances of approximately 16 m and 6 m from the snowgun. The last sample location was a control taken upwind of the snowmaking equipment.
Raw wastewater volume
The volume of raw liquid manure processed was calculated by determining the pumping rates and duration of the snowmaking activities. Changes in rates and air to water ratio make this estimation crude at best, but was the best alternative available. Future trials should incorporate an in-line flow meter in the Snowfluent plant. For the load calculations in section 3.1, percentages of the amount of the snow made that fell in the test plots were estimated at 50% and 75%.
Snowpack volume
Volume of the snowpack was surveyed using a Geodimeter total-station apparatus. The plot was surveyed twice; once shortly after the completion of the snowmaking operation, and again after the completion of snowmelt. This provided three-dimensional data of the snowpack surface, and the ground within the plot. The three-dimensional volumetric difference between these two planes was calculated using a CAD package, and used as the snowpack volume for loading calculations. A 2:1 meltwater equivalent ratio was used to convert snow volume to water volume.
Hydrology of runoff
Runoff from the plot was measured by the use of an H-flume at the plot outlet. Water levels through the flume were measured in an attached stilling well by a float activated level recorder. The rating curve for the flume was developed and calibrated by manually measuring the amount of time taken to fill the various sample bottles, every time a runoff sample was collected. This rating curve was then used to convert the five-minute water level data into five-minute discharge data. Early in the melt season, problems with overnight icing of the float in the stilling well occurred. It was observed during this time that discharge through the flume occurred over fairly consistent hours during the day. For this reason, any 'flow' measured by the frozen float during the night was assumed to be erroneous, and discounted from the discharge tally from the beginning of snowmelt (March 26) until the 13 of April. After April 13 night-time freezing of the float ceased to occur, so all discharges recorded on the lined plot were assumed to be accurate and were included in the discharge tally. Runoff was observed on the plot until April 28.
Precipitation data from the Environment Canada station at ARC Vegreville was used to calculate the volumes of rain and natural snow meltwater that fell on the plot during the aging/melting period (Feb. 23 to Apr. 28). These volumes were subtracted from the recorded runoff volumes for estimates of water loss.
There were two instances where problems with the electronic dataloggers resulted in a loss of meltwater discharge data. In these cases, the missing data was filled in by assuming a straight line between the know data points on either side of the data gap. These instances are visible as straight, sloping lines during the end of March and the second week of April on Figure 2.
The intermittent runoff chemistry data was merged into the discharge data set, based on date and time. This created a data set with continuous five-minute discharge values, but only sporadic water chemistry values. The blanks in the water chemistry portion of this data set were filled in by applying the known water chemistry values halfway to the next, and half way to the last known water chemistry sample. This resulted in a data set with five minute discharge and chemistry data, from which five minute loads could be calculated.
Where mean concentrations are calculated and discussed, the means for all phases of the Snowfluent process except runoff (eg. Raw effluent, fresh snow, etc) are arithmetic means with n<10. The runoff means are flow-weighted (sum of the five-minute loads divided by the total discharge volume), which accounts for the deceptively low standard error (because n is in the thousands) on Table B-1. The standard errors calculated for Runoff in Tables 1 and B-1 are not typical standard errors, since they use the flow-weighted mean concentrations in their measure of variance, instead of the arithmetic mean.
Table A-1: Sampling Schedule for Snowfluent Trial at the Giebelhaus Hog Farm SW of Vegreville
Timeline | # Samples | Type of Samples |
| Week of Snowmaking (Feb. 19-20) | 3 | Control - liquid manure |
| 6 | Snowfluent |
| 8 | Aerosols |
| Snowpack 1- March 10 | 6 | Snowpack |
| Snowmelt | (Day 1) | 6 | Snowpack |
| 1 | Runoff |
| 2 days after snowmelt | 1 | Runoff |
| 3 days after snowmelt | 1 | Runoff |
| 4 days after snowmelt | 1 | Runoff |
| 5 days after snowmelt | 1 | Runoff |
| 1 wk after snowmelt | 1 | Runoff |
| 2 wks after snowmelt | 1 | Runoff |
| 6 | Snowpack |
| 3 wks after snowmelt | 1 | Runoff |
| 4 wk after snowmelt | 1 | Runoff |
| 5 wks after snowmelt | 1 | Runoff |
| 6 wks after snowmelt | 1 | Runoff |
| 6 | Snowpack |
| 7 wks after snowmelt | 1 | Runoff |
| 8 wks after snowmelt | 1 | Runoff |
| 9 wks after snowmelt | 1 | Runoff |
| 10 wks after snowmelt | 1 | Runoff |
| 11 wks after snowmelt | 1 | Runoff |
| 12 wks after snowmelt (approx June 12?) | 1 | Runoff |
| when snow is all gone | 4 | Residue |
| TOTAL | 62 |  |
Table A-2: Parameters Analysed in Water Samples
Water Quality Parameters: |
| Microbiological: | Total Count |
| Faecal Coliform |
| Routine: | pH |
| Conductivity |
| Sodium (Na+) |
| Chloride (Cl-) |
| Sulfate (SO4-) |
| Calcium (Ca++) |
| Total -Hardness |
| Nutrients: | Total Phosphorus (TP) |
| Total Dissolved Phosphorus (TDP) |
| Ortho-Phosphate (o-P) |
| Total Kjeldahl Nitrogen (TKN) |
| Ammonia (NH3+) |
| Nitrate + Nitrite (NO3+NO2) |
| Other: | Biological Oxygen Demand (BOD) |
Appendix B
Table B-1: Mean Concentrations of All Measured Parameters for the Snowfluent/Liquid Hog Manure Trial
| pH | Conductivity | Ca | BOD | TKN | K | NH3-N |
| | µS/cm | mg/L | mg/L | mg/L | mg/L | mg/L |
| mean | SE | mean | SE | mean | SE | mean | SE | mean | SE | mean | SE | mean | SE |
Raw Effluent | 7.53 | 0.07 | 17633 | 120 | 75 | 1 | 6524 | 76 | 2431 | 240 | 1128 | 12 | 1933 | 4 |
Snow | 8.22 | 0.01 | 17640 | 40 | 47 | 2 | 6925 | 49 | 2462 | 126 | n/a | n/a | 2061 | 82 |
Runoff | 8.13 | 0.01 | 7323 | 110 | 21 | <1 | 3360 | 55 | 946 | 15 | 46 | <1 | 1095 | 22 |
| NO2+NO3 N | NO2 - N | Total P | Dissolved P | ortho - P | Particulate P |
| mg/L | mg/L | mg/L | mg/L | mg/L | mg/L |
| mean | SE | mean | SE | mean | SE | mean | SE | mean | SE | mean | SE |
Raw Effluent | 1.244 | 0.173 | 0.516 | 0.132 | 424.5 | 43.7 | 269.4 | 4.1 | 186.9 | 1.2 | 155.18 | 47.57 |
Snow | 0.866 | 0.135 | 0.339 | 0.023 | 329.3 | 32.1 | 243.2 | 2.6 | 190.8 | 5.0 | 86.11 | 32.22 |
Runoff | 0.141 | 0.002 | 0.095 | 0.001 | 131.0 | 1.6 | 112.7 | 1.3 | 106.2 | 1.3 | 18.30 | 0.27 |
| Na | SO4 | Cl | Total Hardness | Total Coliform | Faecal Coliform |
| mg/L | mg/L | mg/L | mg CaCO3/L | CFU/mL | CFU/100mL |
| mean | SE | mean | SE | mean | SE | mean | SE | mean | SE | mean | SE |
Raw Effluent | 720 | 8 | 102 | 5 | 1004 | 9 | 188 | 2 | 2.09x10⁷ | 3.59x10⁵ | 6.71x10⁶ | 5.61x10⁵ |
Snow | 762 | 7 | 103 | 5 | 1083 | 7 | 117 | 4 | 5.51x10⁶ | 9.54x10⁵ | 4.63x10⁵ | 3.34x10⁵ |
Runoff | 327 | 6 | 52 | 1 | 478 | 8 | 54 | <1 | 3.01x10⁶ | 6.87x10⁴ | 27 | <1 |
Appendix C
Table C-1: Residue Content
NH4-N (ppm) | NO3-N (ppm) | PO4-P (ppm) | Na (ppm) | K (ppm) | SO4-S (ppm) | pH | E.C (mS/cm) |
871 | 5 | 513 | 73 | 315 | 51.0 | 7.4 | 2.3 |
Cl (ppm) | CaCO3 (%) | Zn (ppm) | Cu (pm) | Mn (ppm) | Fe (ppm) | Total N (%) | Total P (%) |
44 | 2.25 | 209.5 | 101.6 | 110.6 | 48.7 | 3.4 | 7.80 |
Ca (meq/L) | Mg (meq/L) | Na (meq/L) | K (meq/L) | SAR | Organic Matter (%) | Ash (%) |
18.33 | 20.30 | 1.31 | 1.78 | 0.31 | 45.10 | 54.08 |
Appendix D: Project Photos
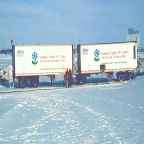
Photo 1. Portable Snowfluent Plant
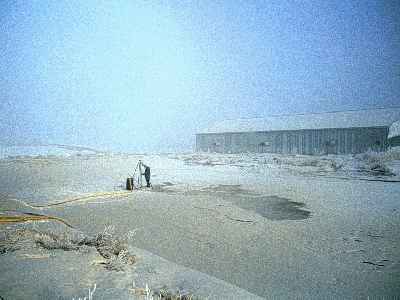
Photo 2: Pumping Raw Liquid Manure From the Lagoon
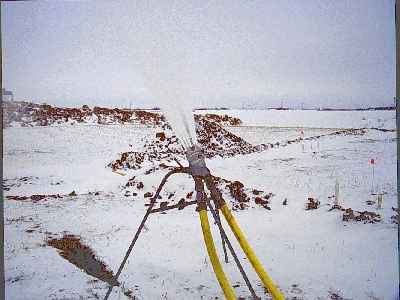
Photo 3. Snowfluent Snowgun
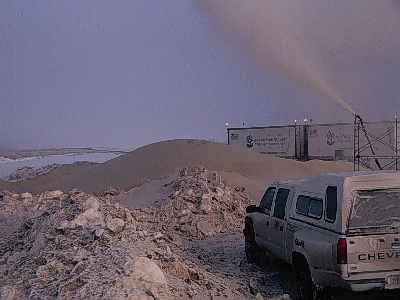
Photo 4. Snowmaking at the Giebelhaus Hog Farm
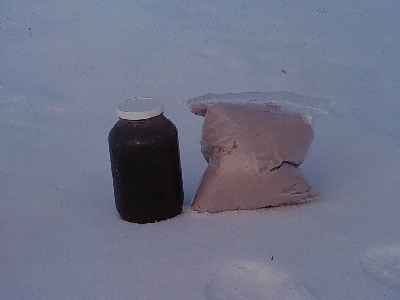
Photo 5. Samples of Liquid Hog Manure and Freshly Made Snowfluent Snow Sitting on Natural Snow
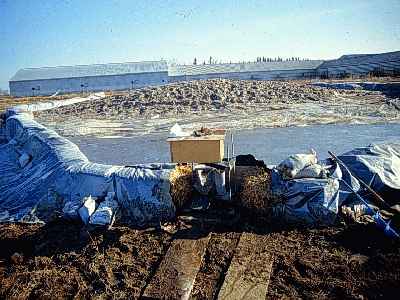
Photo 6. Setup of the Test Plot at Giebelhaus Hog Farm
|
|