| | Farmers often wait for higher prices before making a crop marketing decision. Often waiting can end in disappointment because price targets were either unrealistic or became a moving target, prices fall and much of the crop is eventually marketed at the lower end of the price range for the year.
Price frequency charts can be good tools for farm marketers. This article will show how to use frequency charts to make marketing decisions. A frequency chart shows how often, or what percent of the time, that a price for a crop has reached a certain level. Price frequencies are a good way of viewing prices, particularly high prices, in perspective.
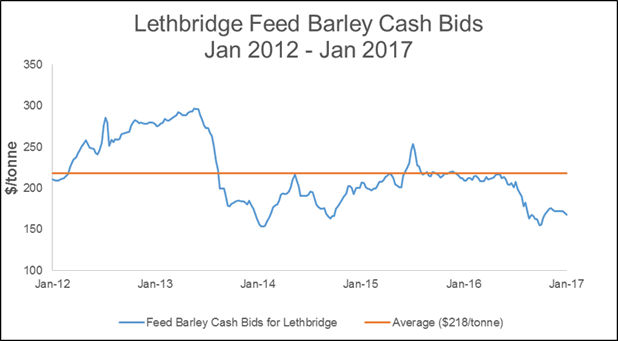
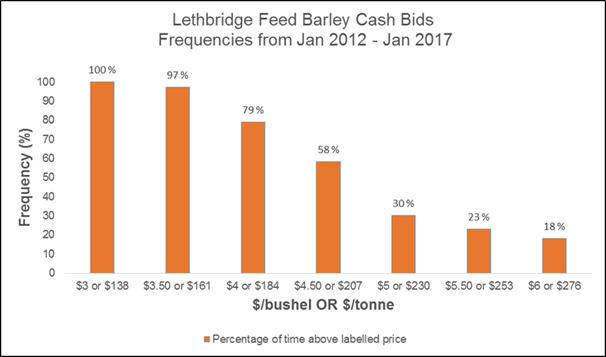
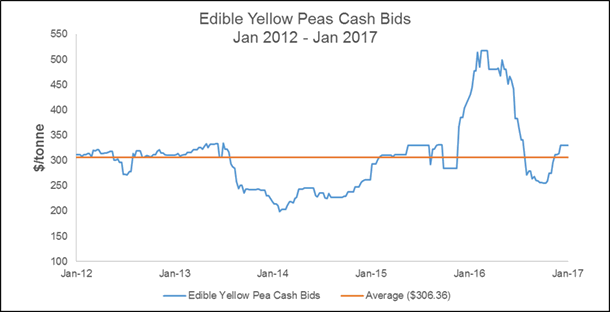
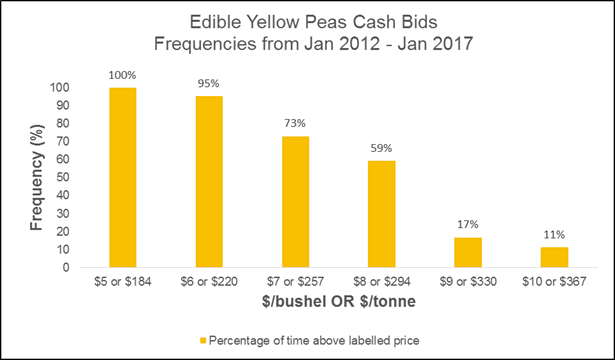
Included below are the weekly cash price frequency charts of central Alberta elevator bids for No. 1 canola, feed wheat, feed barley, and yellow peas from January 2012 to January 2017.
Reading the Charts
Figure 1.
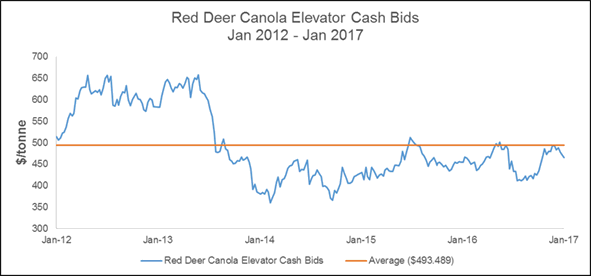
Figure 1 displays the historical prices and average for No. 1 canola from the last five years. Similar charts are displayed below for feed wheat, feed barley, and yellow peas. These charts just give an idea of how prices have moved over the last five years.
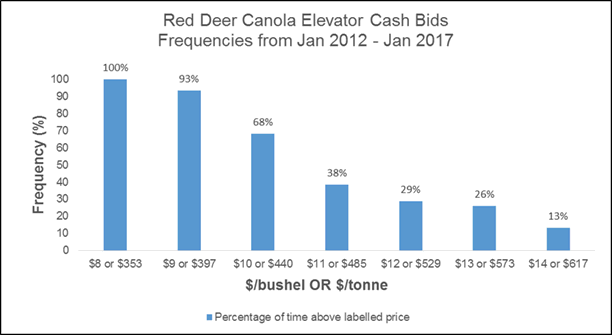
Figure 2 shows price frequencies over the past five years. Starting at the far left, the first vertical bar shows what percentage of the weeks over the past five years that the price for canola has been $8 per bushel or more. In the past five years, canola has sold for at least $8 per bushel ($353 per tonne) 100 percent of the time.
The second bar from the left shows that canola has sold for at least $9 per bushel ($397 per tonne) 93 percent of the time in the past five years. Looking at the $11 per bushel mark, we see that canola was priced at $11 per bushel or more for 38 percent of the time in the past five years.
The charts show price bids for the last five years, and they can be used to make decisions about crop marketing. For instance, if you see a cash price for $13 per bushel for canola, you will know that this is probably a good price because cash prices of $13 or more per bushel only occurred 26 percent of the time during the past five years. Although cash prices are just one consideration when making marketing decisions, price frequency tables are a tool that can help make marketing decisions by adding a historical perspective.
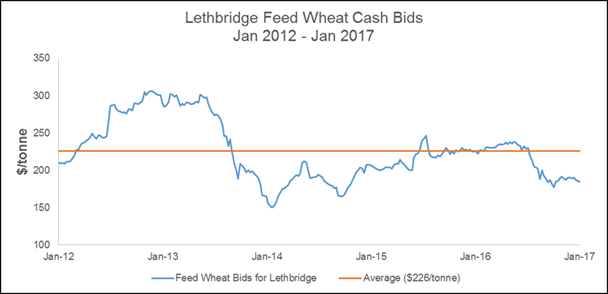
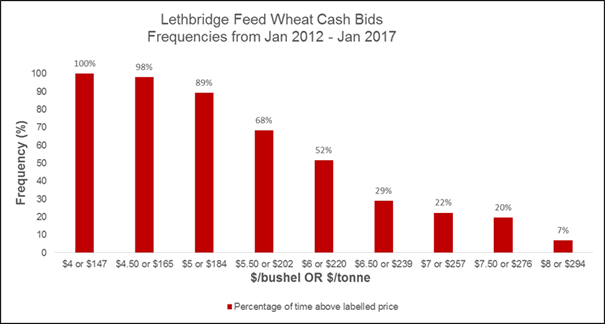
The charts for feed wheat, feed barley, and yellow peas are also included.
Figure 2.
|
|