| | Introduction | Understanding feeder cattle price spreads | Understanding the sliding scale mechanism | Other important notes | Summary | Return to Livestock Marketing page
.
Introduction
A cattle feeder should be able to answer these three questions: 1) when will the cattle “finish”, 2) what is the expected price of fed cattle by that time, and 3) is feeding those animals likely to make money? Factors that impact cattle feeding probability include the price of feeder cattle, the price of fed cattle, feed cost, feeding costs, rate of gain, death losses and interest rate. A producer should be aware of the seasonality of prices and the sliding scale in order to make better marketing decisions.
When feeder cattle prices are quoted, animals are typically classed by gender and weight. The relationship between price and weight varies seasonally and over time. Regular or average cattle price changes within a year are captured by the price seasonality concept. A “price slide” is often used to adjust for the differences between the actual weight of the cattle and the base weight on which a base price is established. These two factors affect the final price the seller (buyer) would receive (pay) for the finished cattle. The concepts are explored in greater depth in the following sections.
Understanding Feeder Cattle Price Spreads
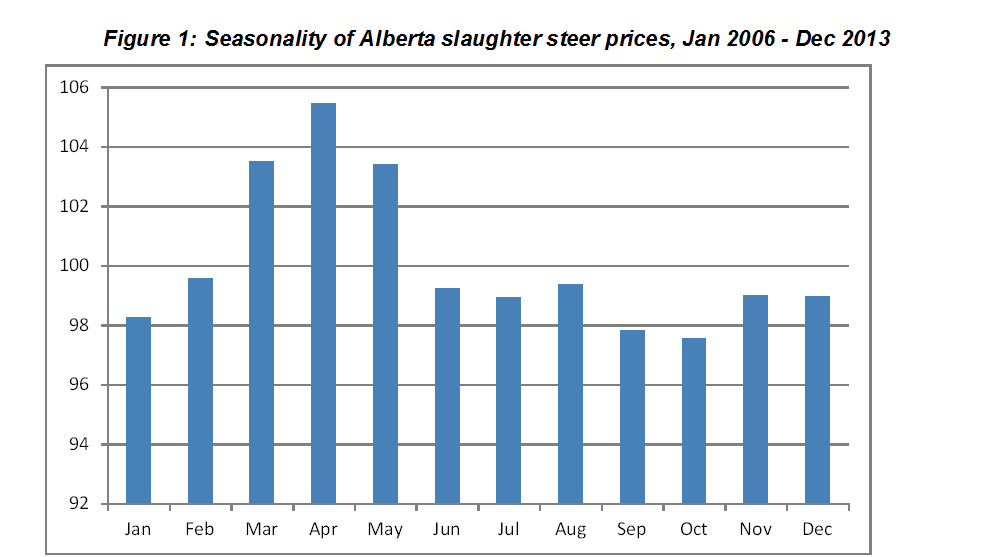
Different supply and demand situations result in seasonal price patterns during the year. Seasonality is measured by an index stating average prices over a particular time (usually in a specific month) relative to annual average prices. Different classes of animals have their distinct price seasonality patterns. For instance, fed cattle prices tend to peak in late winter or early spring before moving lower into summer due to supply and demand reasons. Figure 1 shows the seasonal price pattern for finished steers in Alberta. The chart shows seasonality with an index of 100 representing the annual average. The March bar, for example, shows that during the eight year period, from January 2006 to December 2013, A1 and A2 steer price in March tends to average 3.5 per cent above the annual average. The September price tends to average 2.2 per cent below the annual average.
This seasonal price pattern for fed cattle results in a fairly predictable pattern in the feeder cattle price spread. For example, in late summer, mid-weight feeders in the range of 600 to 700 pounds may have a small price per pound discount compared to feeder calves in the 500 to 600 pound weight range. If placed in a finishing feedlot at the beginning of September, a 650 pound steer would finish in about 210 days, around the end of March when slaughter cattle prices tend to be seasonally strong. Alternatively, a 550 pound steer, if placed in a finishing feedlot at the beginning of September, would not finish until the end of April. Perhaps after fed cattle prices have peaked.
As we move through the fall, 600 to 700 pound feeders become less desirable to buyers for two reasons: 1) If placed in a feedlot in late November at 650 pounds, they will not finish until mid-June, when fed cattle prices tend to be seasonally weaker. 2) A 650-pound feeder, if “backgrounded” at a lower rate of gain, would become a 900- to 950-pound heavy feeder by spring. The 900- to 950-pound feeder at the end of April would not be as desirable for the “grasser” market. If placed in a finishing feedlot, it would be ready for slaughter about mid-August, when prices tend to be seasonally lower.
However, a 550-pound steer in late November could be backgrounded through the winter and sent to grass in the spring. Alternatively, it could be placed into a finishing feedlot as a 800-850 pound feeder. It would then be ready for slaughter in October, when prices are typically starting to improve from their summer lows.
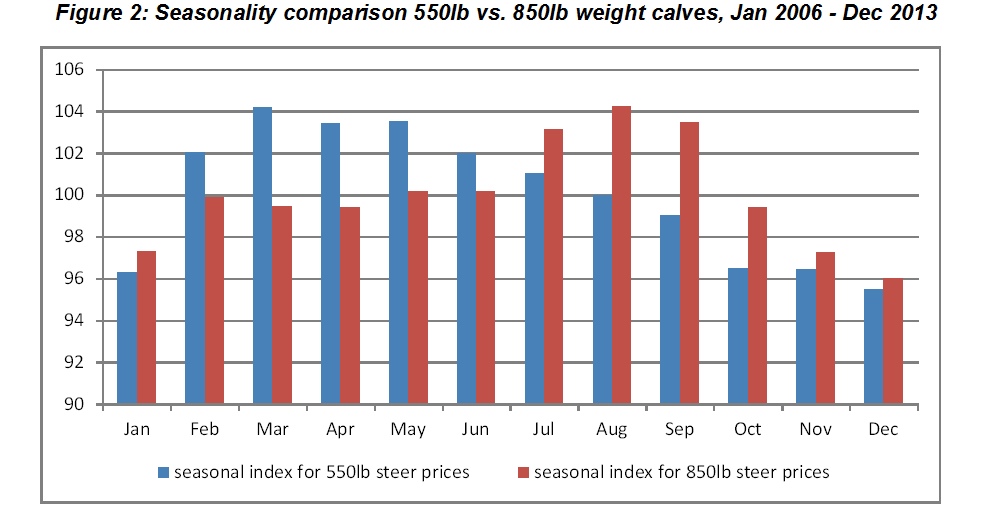
Figure 2 shows how relative prices change during the year for different weight classes. The chart shows an eight year seasonal index price comparison between 550 lb (blue bars) and 850 lb (red bars) feeder cattle for Alberta. Much of the relative price difference can be explained by a combination of:
- when those feeders would finish if placed in a feedlot, and
- the seasonal supply and demand for the respective weight classes.
Moving from winter into spring, the supply of 550-pound calves becomes less. Meanwhile, heavier weight feeders become more plentiful as cow-calf operators sell their backgrounders. Feedlots are not usually aggressively bidding for those heavy weights since they will finish at a time that fed cattle markets are seasonally weak and because there are more of them marketed at that time. Into the fall, heavy weight feeders become more desirable since they will finish when fed cattle prices are seasonally stronger, while lighter weight feeders are plentiful in supply as a considerable amount of calves are weaned and sold in the fall.
Understanding the Sliding Scale Mechanism
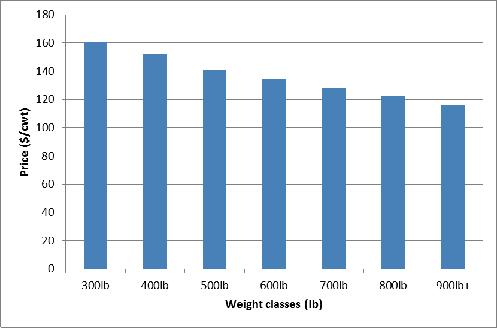
Usually lighter weight feeder cattle are sold for a higher price per pound. Figure 3 indicates the 5-year (2009-2013) average steer price for different weight classes in the month of September for Alberta. Prices for steers decrease as weight increases. In cash forward contracts both the buyer and seller encounter risk from weight differences at the time of delivery compared to the time the contract was entered into. A “Price slide” is the usual approach to deal with this type of uncertainty. The sliding scale enables bids for cattle to be presented by the buyer to the seller prior to actually weighing of the animals.
Figure 3: Five year average prices for different weight classes of steer in Alberta
The numbers used in a sliding scale should be derived from the market. Here is an example. The cattle owner must be aware of current market prices for similar cattle to determine the fairness of a bid and the slide being offered. This means the producer must visit auction markets to observe cattle sales, watch internet or satellite sales, consider the seasonal price trend of various feeder cattle weight groups and seek market opinions from others in the industry.
Suppose the current average price for 650-weight steer calves is $1.27/pound, the average price for 550-weight steer calves is $1.33/pound, and the average price for 450-weight steer calves is $1.41/pound. Now, consider a group of average quality steer calves bid on at the farm. The buyer estimates their average weight at 550 pounds. Based on the current market conditions, that group of 550-weight calves should be worth about $1.33/pound. However, since the weight of those calves is just an estimate at this point, the buyer and seller may wish to build an adjustment factor into the offer to account for any difference between the estimated weight of 550 pounds and the actual weight of the calves to be determined later upon weighing at delivery.
Since the current market price for 450-weight steer calves is $1.41/pound, or eight cents a pound more than 550-weight steers, it would be appropriate to positively adjust the price of the farm calves by eight cents a pound for every hundred pounds that the actual weight is less than the 550-pound base weight.
On the other hand, the current price of 650-weight steer calves is $1.27/pound, or six cents a pound less than 550-weight steers, so it would be appropriate to negatively adjust the price of the farm calves by six cents a pound for every hundred pounds that the actual weight is greater than the 550 pound base weight. If these adjustments became part of this bid, the bid would be $1.33/pound for a base weight of 550 pounds, with a “06” up and a “08” down slide.
Using this sliding scale, often called “zero-six up” and “zero-eight down”, and a base price of $1.33/pound for 550-weight steers, here is how the price would be adjusted after the cattle are actually weighed. If the actual average weight of the cattle is 575 pounds, or 25 pounds greater than the base weight, the final price would be $1.33 - (25/100 X .06) or $1.3150. If the actual average weight of the cattle is 530 pounds, or 20 pounds less than the base weight, the final price would be $1.33 + (20/100 X .08) or $1.3460.
The price slide can reflect anticipated feeding efficiencies. For example, higher performing feeders may have a smaller slide adjustment than less efficient feeders.
Other important Notes:
Other factors affecting price spreads between feeder cattle weight classes are demand-related to the backgrounding, grasser, or breeding heifer market. Rising feed grain prices tend to disfavor the value of lighter feeders compared to heavier weight feeders since it costs more for the cattle to gain weight on a higher cost grain-based ration. Ample forage supplies tend to favor the value of lightweight feeders as forage owners bid up the feeder price in an effort to turn their low-value forage into beef. Feeder heifer demand for the breeding market usually improves when bred cows become relatively high-priced. Conversely, when the beef industry is in contraction mode (declining beef cow numbers), the demand and price for feeder heifers tends to drop relative to steers.
Summary
This article sheds some light on different relationships between price and weight of cattle. Price and weight as well as gender relationships vary in different ways. There is a relationship between weight and price at a specific time for any class of animal. Also, the price of any weight class of animal has a seasonal pattern. The time when prices tend to peak is different for different weight classes. Sometimes, there is a time gap between contract and delivery of the finished cattle. A sliding scale of prices can be used to account for differences between estimated and actual weights. Understanding all these trade-offs helps a producer make a better decision.
|
|