| | Annual Overview | Cost by Month - Family of Four | Weekly Food Cost Graph
Table 1: Average Weekly Cost Annual Overview 2003
Age-Gender
Group | Dairy
Products | Eggs | Meat,
Poultry & Fish | Meat
Alternatives | Cereal
&
Bakery
Products | Citrus
Fruit &
Tomatoes | Other
Fruit | Potatoes | Other
Vegetables | Fats &
Oils | Sugars
&
Other
Sweets | Total
Weekly
Cost (a) |
(Dollars per week) |
| Child |
| 1 year | 5.05 | 0.31 | 1.52 | 0.26 | 2.82 | 0.40 | 1.80 | 0.77 | 1.38 | 0.44 | 0.16 | 14.90 |
| 2-3 years | 4.33 | 0.31 | 1.90 | 0.26 | 4.13 | 0.42 | 1.80 | 0.77 | 1.38 | 0.66 | 0.16 | 16.11 |
| 4-6 years | 5.41 | 0.46 | 2.28 | 0.52 | 6.01 | 1.05 | 2.00 | 1.07 | 1.52 | 0.87 | 0.39 | 21.58 |
| Boy |
| 7-9 years | 4.33 | 0.46 | 4.19 | 0.52 | 7.51 | 1.05 | 2.20 | 1.36 | 3.03 | 1.31 | 0.39 | 26.35 |
| 10-12 years | 6.49 | 0.46 | 5.71 | 0.52 | 8.26 | 1.57 | 2.90 | 1.41 | 5.44 | 1.31 | 0.55 | 32.21 |
| 13-15 years | 7.93 | 0.46 | 7.62 | 1.04 | 8.63 | 1.57 | 2.90 | 1.75 | 4.13 | 1.31 | 0.55 | 37.90 |
| 16-18 years | 6.85 | 0.46 | 12.19 | 1.04 | 10.51 | 1.57 | 3.50 | 2.03 | 4.13 | 1.53 | 0.55 | 44.37 |
| Girl |
| 7-9 years | 5.05 | 0.46 | 3.81 | 1.04 | 5.38 | 1.47 | 2.20 | 1.16 | 3.03 | 0.87 | 0.38 | 21.92 |
| 10-12 years | 7.50 | 0.46 | 3.81 | 1.04 | 6.57 | 1.57 | 3.00 | 1.16 | 3.03 | 0.87 | 0.38 | 25.88 |
| 13-15 years | 7.21 | 0.46 | 4.57 | 1.04 | 7.13 | 1.68 | 3.00 | 1.25 | 4.13 | 0.87 | 0.38 | 27.79 |
| 16-18 years | 5.05 | 0.46 | 6.09 | 1.04 | 6.38 | 1.68 | 3.00 | 1.25 | 4.13 | 0.87 | 0.38 | 26.30 |
| Man |
| 19-24 years | 5.05 | 0.46 | 12.57 | 1.30 | 9.38 | 1.68 | 3.50 | 2.03 | 4.13 | 1.53 | 0.55 | 42.19 |
| 25-49 years | 5.05 | 0.46 | 12.57 | 1.04 | 8.07 | 1.68 | 3.50 | 2.03 | 4.55 | 1.31 | 0.39 | 40.65 |
| 50-74 years | 5.05 | 0.46 | 11.04 | 1.04 | 6.38 | 1.68 | 3.50 | 1.70 | 4.55 | 0.87 | 0.32 | 36.58 |
| 75+ years | 5.05 | 0.46 | 9.14 | 1.04 | 5.63 | 1.68 | 3.50 | 0.97 | 4.55 | 0.66 | 0.32 | 32.98 |
| Woman |
| 19-24 years | 5.05 | 0.46 | 6.85 | 1.04 | 6.19 | 1.68 | 3.00 | 1.45 | 4.13 | 0.87 | 0.32 | 31.05 |
| 25-49 years | 5.05 | 0.46 | 6.47 | 1.04 | 5.26 | 1.68 | 3.00 | 0.97 | 4.55 | 0.66 | 0.32 | 29.44 |
| 50-74 years | 5.05 | 0.46 | 6.47 | 1.04 | 4.69 | 1.68 | 3.00 | 0.97 | 4.55 | 0.66 | 0.24 | 28.80 |
| 75+ years | 5.05 | 0.46 | 6.47 | 0.78 | 4.51 | 1.68 | 3.00 | 0.97 | 4.13 | 0.66 | 0.16 | 27.86 |
| Pregnancy(b,c) |
| Trimester 1 | 8.29 | 0.46 | 5.33 | 0.78 | 5.44 | 2.52 | 3.00 | 0.97 | 4.55 | 0.66 | 0.16 | 32.15 |
| Trimester 2 | 9.01 | 0.46 | 5.71 | 0.78 | 6.19 | 2.52 | 3.00 | 1.15 | 4.55 | 0.66 | 0.16 | 34.20 |
| Trimester 3 | 9.01 | 0.46 | 5.71 | 0.78 | 6.19 | 2.52 | 3.00 | 1.16 | 4.55 | 0.66 | 0.16 | 34.20 |
| Lactation(c) | 9.01 | 0.46 | 5.71 | 0.78 | 6.76 | 2.52 | 3.00 | 1.16 | 4.55 | 0.87 | 0.16 | 34.98 |
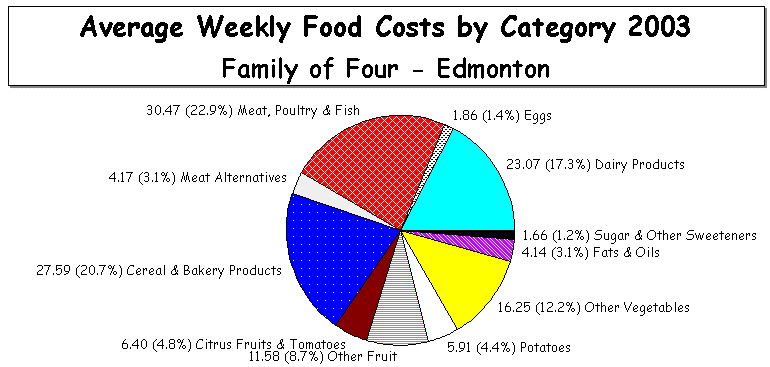
| Family of Four (d) | 23.07 | 1.86 | 30.47 | 4.17 | 27.59 | 6.40 | 11.58 | 5.91 | 16.25 | 4.14 | 1.66 | 133.11 |
Average weekly food costs reflect inclusion of Club Card pricing, where applicable.
(a) Add 10% of total to cost of basket to cover condiments, baking supplies, tea, coffee, soft drinks, etc. and iron supplement for pregnant women.
(b) A daily iron supplement is required for pregnant women.
(c) Based on the requirements of a woman 25-49 years old.
(d) Composed of a man (25-49 years), a woman (25-49 years), a boy (13-15 years) and a girl (7-9 years).
Beginning with January 2000, the Weekly Quantities of Food Required by Specified Age and Gender Group have been updated to reflect the latest information available from Health Canada.
Table 2: Average Weekly Cost by Month - Family of Four 2003
Table 2 - AVERAGE WEEKLY COST FOR FAMILY OF FOUR(a), EDMONTON - 2003 |
 | | | Meat, | | Cereal & | Citrus | | | | | Sugars & | Total |
| Dairy | | Poultry & | Meat | Bakery | Fruit & | Other | | Other | Fats & | Other | Weekly |
| Month | Products | Eggs | Fish | Alternatives | Products | Tomatoes | Fruit | Potatoes | Vegetables | Oils | Sweets | Cost (b) |
| January | 23.14 | 1.80 | 30.41 | 4.35 | 27.73 | 6.71 | 11.46 | 6.11 | 16.04 | 4.21 | 1.72 | 133.70 |
| February | 22.85 | 1.84 | 31.00 | 4.33 | 27.30 | 5.72 | 11.01 | 6.34 | 15.44 | 4.10 | 1.63 | 131.57 |
| March | 23.18 | 1.81 | 31.89 | 4.20 | 27.51 | 6.38 | 11.95 | 6.17 | 15.98 | 4.05 | 1.71 | 134.81 |
| April | 23.22 | 1.84 | 31.75 | 4.15 | 27.20 | 6.28 | 11.29 | 5.90 | 16.64 | 3.97 | 1.61 | 133.86 |
| May | 23.30 | 1.83 | 31.69 | 4.13 | 27.41 | 5.93 | 11.49 | 6.22 | 17.51 | 4.13 | 1.72 | 135.36 |
| June | 23.38 | 1.78 | 30.43 | 4.18 | 27.40 | 6.21 | 11.96 | 6.05 | 17.44 | 4.17 | 1.67 | 134.66 |
| July | 23.14 | 1.82 | 29.43 | 4.14 | 27.50 | 6.33 | 11.85 | 6.52 | 17.24 | 4.24 | 1.73 | 133.93 |
| August | 23.03 | 1.93 | 27.45 | 4.17 | 27.24 | 6.57 | 11.80 | 6.92 | 16.86 | 4.23 | 1.61 | 131.81 |
| September | 22.98 | 1.92 | 29.47 | 4.10 | 27.78 | 6.43 | 11.46 | 5.51 | 14.96 | 4.09 | 1.71 | 130.41 |
| October | 22.88 | 1.89 | 30.32 | 4.04 | 27.74 | 6.42 | 11.50 | 4.66 | 14.42 | 4.18 | 1.62 | 129.70 |
| November | 22.83 | 1.95 | 30.36 | 4.09 | 27.67 | 6.79 | 11.75 | 5.59 | 15.24 | 4.35 | 1.57 | 132.20 |
| December | 22.89 | 1.93 | 31.39 | 4.20 | 28.60 | 7.00 | 11.49 | 4.97 | 17.23 | 3.99 | 1.56 | 135.26 |
| Average 2003 | 23.07 | 1.86 | 30.47 | 4.17 | 27.59 | 6.40 | 11.58 | 5.91 | 16.25 | 4.14 | 1.66 | 133.11 |
Average weekly food costs reflect inclusion of Club Card pricing, where applicable.
(a) Composed of a man (25-49 years), a woman (25-49 years), a boy (13-15 years), and a girld (7-9 years).
(b) Add 10% of total cost of basket to cover condiments, baking supplies, tea, coffee, soft drinks, etc. and iron supplements for pregnant women.
Beginning with January 2000, the Weekly Quantities of Food Required by Specified Age and Gender Group have been updated to reflect the latest information available from Health Canada.
Average Weekly Food Cost 2003 Graph
|
|