| | Problem | Study description | Major findings | Applied questions | References
Problem
In Alberta, an estimated 1.6 million acres are affected by soil salinity3. The high salt concentration in a saline seep prevents the uptake of water and essential nutrients by plant roots. This restricts or eliminates plant growth and reduces crop yields.
A saline seep forms when groundwater carrying dissolved salts rises to the soil surface. The water evaporates while the salts remain behind, accumulating over time. Saline seep formation is a function of climatic conditions, groundwater flow systems, surface drainage patterns, agricultural practices and the inherently saline nature of some Alberta soils2.
The objective of this study was to assess long- and short-term trends in dryland soil salinity in Alberta. Trends in salinity extent and intensity are difficult to determine because of the large area affected by salinity and the tendency of salts to move rapidly up to the soil surface and back down into the soil profile. Understanding these trends will help researchers to develop more effective salinity control measures, governments to develop appropriate salinity control programs, and farmers to have greater success in controlling saline seeps.
Study Description
In the early 1990s, salinity was monitored at three dryland saline seeps near Carmangay (1993 to 1996), Crossfield (1991 to 1996) and Forestburg (1993 to 1996). Based on the salinity classification system used in Alberta1, the Crossfield site has a depression bottom saline seep, the Carmangay site has a contact saline seep, and the Forestburg site has a slough ring seep. The three sites are in locations which are representative of the farming systems and the geologic, hydrogeologic and climatic conditions in their area.
Long-term trends in the extent of salinity visible at the soil surface were assessed from aerial photographs spanning about 40 years for each site. The interpretation of visible salinity from aerial photographs is very subjective.
Short-term trends in the extent and intensity of salinity were determined based on soil analyses and EM38 surveys at each site. Soil samples were analysed for electrical conductivity (EC), and anion and cation concentrations. (EC indicates the concentration of soluble salts. It is measured in deciSiemens/metre (dS/m). EC ranges from less than 2 dS/m for non-saline soils to greater than 16 dS/m for very strongly saline soils.)
The EM38 surveys were used to measure total salinity in detail during the spring and fall of each year. The EM38 is an electromagnetic meter which measures bulk salinity to a depth of 1.5 m when the EM38 is in the vertical position and to 0.75 m when it is in the horizontal position. The EM38 readings are converted to EC values in dS/m.
Monitoring instruments were installed at several locations at each site to measure soil moisture and groundwater. Soil moisture data were collected from nests of tensiometers, at 30, 60 and 90 cm depths. Groundwater depth and hydraulic head were monitored with water table wells and nests of piezometers. A weather station was set up at each site to measure wind speed, solar radiation, temperature, humidity, precipitation and soil temperature.
Each site had some salinity control measures. At Crossfield, a mixture of Beaver alfalfa and pubescent wheatgrass was planted in and around the seep in 1991. (Alfalfa is a deep-rooted perennial crop able to consume more water per unit depth of soil and from a greater depth than most other annual or perennial crops.) At Carmangay, a dam was built to reduce the flow of surface water across the saline area. At Forestburg, forages and some trees were retained in a band around the slough to reduce the flow of shallow groundwater outward from the slough (see Factsheet for information on slough ring salinity).
Major Findings
Long-Term Trends in the Extent of Visible Salinity
Figure 1 shows the change over time in the visibly salt-affected area at the Carmangay site as shown in air photographs.
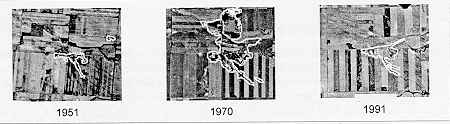
Figure 1. Visibly saline area at the Carmangay site, 1951 to 1991
Figure 2 shows the changes in the area of visible salinity at the sites from the early 1950s to the early 1990s. The Carmangay seep increased from 1951 to 1970, and decreased from 1970 to 1991. The Forestburg seep decreased from 1950 to 1970, and increased from 1970 to 1990. The Crossfield seep fluctuated greatly. The great variability in the data and the sometimes opposing trends between sites indicate the need for a large number of data points over time for many representative sites to determine regional trends.
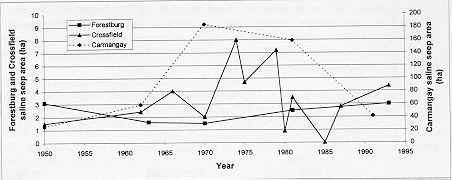
Figure 2. Area of visible salinity between 1950 and 1993, Carmangay, Forestburg and Crossfiled sites
Short-Term Trends in Salinity
Overall trends: At the Crossfield site, soil analyses indicated that the trend in concentration in the surface layer of the saline seep was almost level over the monitoring period. Salinity at shallow depths slowly increased (Figure 3), while concentrations at greater depths nearly doubled over the study period.
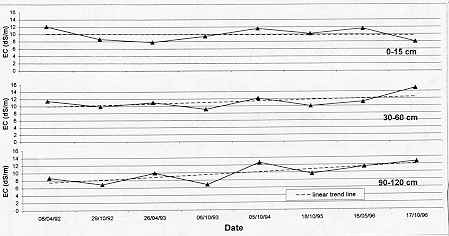
Figure 3 . Salinity at various depths from 1992 to 1996, in a saline seep near Crossfield
The accumulation of salts in the subsoils of seeps is a major concern. A small change in land management or weather conditions could cause the salts to move up to the surface, dramatically decreasing crop growth. This shows the need to permanently leave most saline areas in salt-tolerant forages.
The EM38 surveys provided information on salinity intensity and extent. At Crossfield, the total area affected by salinity increased from 1991 to 1996, but salinity intensity decreased. That is, the area with weakly saline soils increased while the area with moderately to strongly saline soils decreased. For the Carmangay and Forestburg seeps, no overall trends in salinity extent and intensity were discernable over the four-year monitoring period due to the few data points and the large variance.
Seasonal patterns
Figure 4 shows examples of the salinity maps for the Crossfield seep based on the EM38 survey in the vertical position. In spring 1993, the Crossfield seep was strongly saline. During 1996, salinity levels were moderate to strong in the spring and low to moderate in the fall, the expected seasonal pattern.
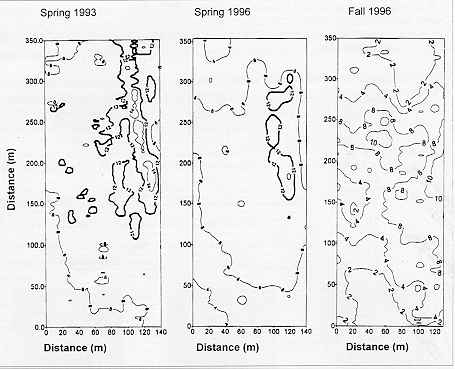
Figure 4. Salt concentration (dS/m) from EM38 survey, Crossfield site, 1993 and 1996
At the Forestburg site, the EM38 readings showed that salinity concentrations in the seep varied considerably from spring to fall and year to year. The salinity level was higher in the spring than the fall of 1993, the usual seasonal trend. Salt concentrations were low to moderate in the fall of 1993, moderate to very strong in the fall of 1994, and moderate to strong in the falls of 1995 and 1996.
At the Carmangay site, the EM38 readings showed that concentrations were moderate to strong in the spring of 1993 and strong to very strong in the fall of 1993. The higher concentrations in the fall may have been influenced by the high precipitation in the 1993 growing season. During 1996, salt concentrations were strong to very strong in the spring and moderate to strong in the fall.
Extent of visible salinity versus subsoil salinity
Salinity is visible on the soil surface when the surface layer is approximately 12 dS/m or higher. For some types of seeps, the subsoils in a large area surrounding the visible part of the seep are also saline. For example, in the depression bottom saline seep at the Crossfield site, the area affected by subsoil salinity was about five times the visibly saline area in the fall of 1996 (Figure 4).
Certain types of saline seeps, such as depression bottom, contact, slough ring and outcrop seeps, have a substantial area of subsoil salinity surrounding the visibly saline area. These large areas with subsoil salinity emphasize the need to plant salt-tolerant grasses on a much larger area than the visibly saline area for salinity control.
Short-term trends in water table depth
Water table levels fluctuated by as much as 1.5 m between winter and spring. For example, in the early 1990s the water table in the saline seep at Crossfield was high in the spring, sometimes within 0.5 m of the soil surface, and fell to about 2 m in midwinter (Figure 5). The shallower the water table, the more rapid the flow of saline groundwater to the soil surface through capillary rise. As a result, surface salinity in the seeps tended to be greatest in the spring for most sites and most years. Spring is also the time when salts cause the greatest reductions in crop yield because spring-seeded crops are very susceptible to salinity during the germination and early seedling stages.
Crossfield experienced above-average precipitation in the early 1990s. As a result, the overall trend of the water table depth in the saline seep at the Crossfield site was upward. The rise in the water table contributed to the increased subsoil salinity.
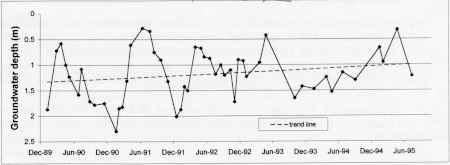
Figure 5. Water table depth in the saline seep at the Crossfield site, 1990 to 1995
Applied Questions
What are the long- and short-term trends in soil salinity in Alberta?
Using aerial photographs from the 1950s to the 1990s for the three sites, no consistent long-term trends were found in the area of salinity visible at the soil surface. The fluctuations in the data and the sometimes opposing trends between the sites indicate the need for a large number of data points over time and space to detect regional trends in the area affected by visible salinity.
Similarly, the EM38 readings over four growing seasons at the Forestburg and Carmangay sites showed much variation, making it difficult to determine short-term regional trends in the extent or intensity of salinity. At the Crossfield site, the total salt-affected area increased but salinity intensity decreased.
What is the relationship between the water table level and salinity?
In saline seeps, shallow water tables cause increased capillary rise, which works like a wick in a kerosene lamp to draw the saline water to the soil surface. Usually water tables are shallowest in the spring because of the large amount of water from spring snowmelt. As a result, salt concentrations in the root zone are generally highest in the spring.
What types of controls are most effective?
Salt-tolerant grasses should be planted in all types of saline seeps. These grasses dry out the root zone and thereby prevent the rise of salty water to the surface of the seep. Even weeds such as kochia are preferable to bare soil on a saline seep.
Other types of control measures depend on the type of salinity. In some types, surface water management is appropriate. In other types, vegetative measures are effective. For example, depression bottom seeps form in low lying areas that temporarily hold surface water. This salinity type can often be reduced by using a grassed waterway to carry surface water away from the seep.
References
- Kwiatkowski, J., Marciak, L.C., Wentz, D. and Vanderpluym, H. 1994. Salinity mapping by landscape, County of Vulcan, Alberta. Alberta Agriculture, Food and Rural Development and Agriculture and Agri-Food Canada, Edmonton.
- Pawluk, S. and Bayrock, L.A. 1969. Some characteristics and physical properties of Alberta tills. Research Council of Alberta Bulletin 26.
- Sommerfeldt, T.G., Thompson, M.D. and Prout, N.A. 1984. Delineation and mapping of salinity in southern Alberta from LANDSAT data. Can. J. Remote Sensing 10(2): 104-110.
Return to CAESA Soil Quality Program Research Factsheets
This information is provided by Don Wentz and H. Vanderpluym. |
|