| | Overview:
The realities of the grass and legume seed trade are now showing in Canadian grass and legume seed export statistics. The economic downturn in late 2008, and its subsequent effect on the North American housing market, combined with strong commodity prices worldwide for mainstream agricultural crops, resulted in lower prices for grass and legume seed. The subsequent rebound in pricing though has occurred while production and inventory levels have been falling.
In a nutshell:
- 2008 world economic crisis results in North American housing market doldrums, which in turn results in lower demand for turf grass seed
- Increase in corn and soybean production, in addition to a devastating drought in the USA, results in stronger prices for wheat and canola crops
- Weakened grass and legume seed prices results in Canadian farmers switching to more profitable crop production
- With lower grass and legume seed production, on farm inventory levels fall as deliveries continue
- Cattle numbers in North America continue to fall as drought conditions force liquidation of cow herds, especially in the USA. Demand for forage seeds falls.
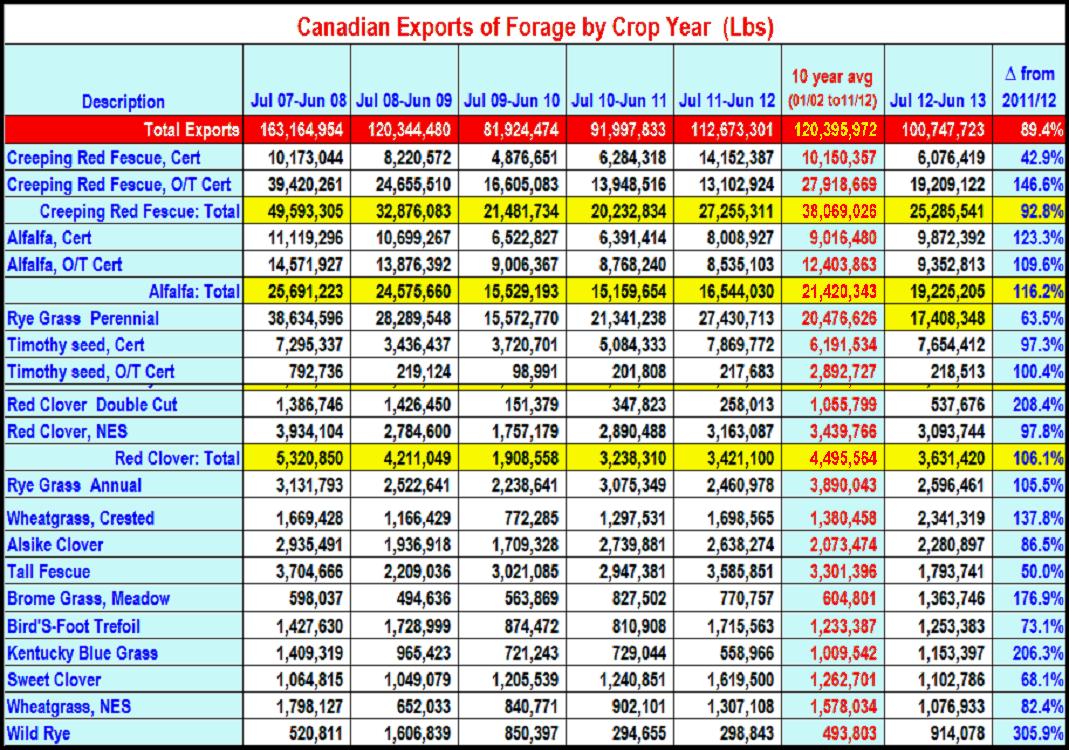
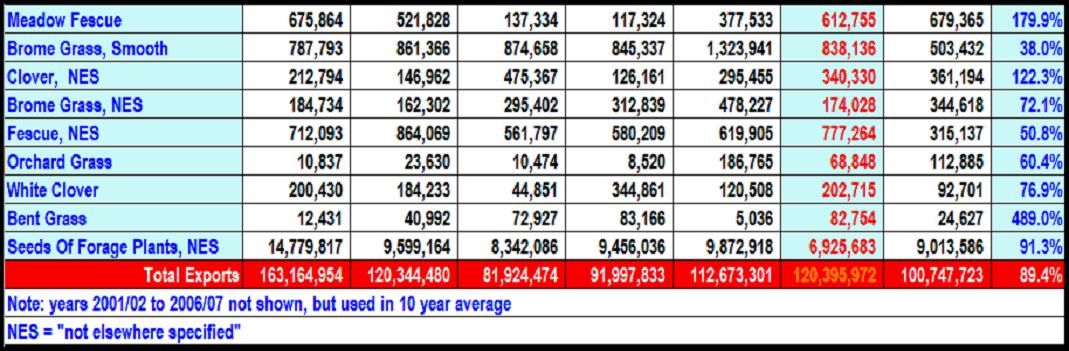
Table 1: Canadian Export Trade Data by Species, 2007/08 to 2012/13 (lbs.)
Canadian Grass and Legume Seed Exports by Quantity
Canadian companies exported just over 100 million lbs. of grass and legume seed in the crop year 2012/13. This was down by over 10 per cent from the previous year. Export trade continues to be led by three major species, creeping red fescue, alfalfa, and perennial ryegrass. Seed mixtures (shown as “seeds of forage plants”) continue to hover around 9 million lbs. exported annually. The decline in the Canadian grass and legume seed industry can be seen when the latest trade data is compared to the 10 year average, which shows total exports down by close to 20 million lbs. This is not expected to get any better, as stored on-farm inventory and current production levels have decreased the past 2-3 years.
Canadian Grass and Legume Seed Exports by Species
By volume, creeping red fescue seed reclaimed the position of Canada’s number one most exported species, followed by perennial ryegrass, which held the number one position the past two years. Exports of creeping red fescue (25.3 million lbs.) fell by 2 million lbs. from the previous year, and is an incredible 13 million lbs. below the 10 year average. Of the total “creeper” exported, certified seed accounted for 24%.
Compared to 2011/12, exports of perennial ryegrass fell by an astonishing 10 million lbs., with only 17.4 million lbs. exported this past crop year. Contract production in Manitoba has fallen off dramatically. In the previous 10 years, yearly perennial ryegrass seed exports averaged over 20.4 million lbs. Perennial ryegrass exports, as a species, fell to 3rd this past crop year.
Total alfalfa seed exports claim the no. 2 position in the ranking of Canadian grass/legume seed exports, with 19.2 million lbs. of seed exported. This is composed of 51% certified seed and 49% common seed. Alfalfa seed saw exports increase by 2.7 million lbs. from the previous year. Certified seed exports were up almost 1.9 million lbs., as compared to an increase in common seed exports of only 800,000 lbs.
Canadian timothy seed exports rank 4th, but total lbs. exported dropped to 7.9 million lbs. Certified timothy dominates total timothy seed exports, accounting for 97% of total timothy seed exports (7.6 million lbs.). Exports in 2012/13 were comparable to the previous year (2011/12 = 8.1 million lbs.). Please see note below under USA.
Other notable stats include:
- Red clover exports (3.631 million lbs.) increased by 200,000 lbs. this past year, but still below the 10 year average export number of 4.5 million lbs. annually.
- Crested wheatgrass exports increased significantly (up 38%). Exports have climbed the past 3 years, and last years’ exports (2.3 million lbs.) are well above the 10 year average of 1.38 million lbs.
- Alsike clover exports remained above the 10 year average, (2012/13 = 2.28 million lbs., 10 year average = 2.07 million lbs.) However, exports fell 13.5% compared to 2011/12.
- After being ignored for the past few years, meadow bromegrass seed exports (1.36 million lbs.) rebounded 176% compared to 2011/12. 2012/13 exports are double the 10 year average (600,000 lbs.). Inroads are being made into the USA market
- Although local smooth bromegrass seed prices hit historical price levels, a lack of inventory saw only � a million lbs. exported in 2012/13, down 62 % from the previous year.
- Grass and legume seed mixtures continue to be exported as such, and in high volume (9 million lbs. in 2012/13). Mixtures are listed as “Seeds of Forage Plants, NES” (not elsewhere specified).
Value Of Canadian Grass/Legume Seed Exports
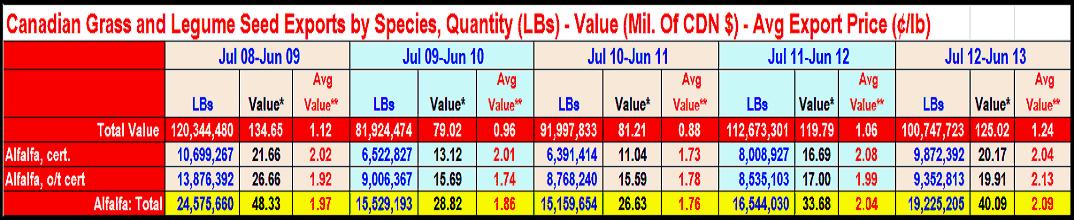
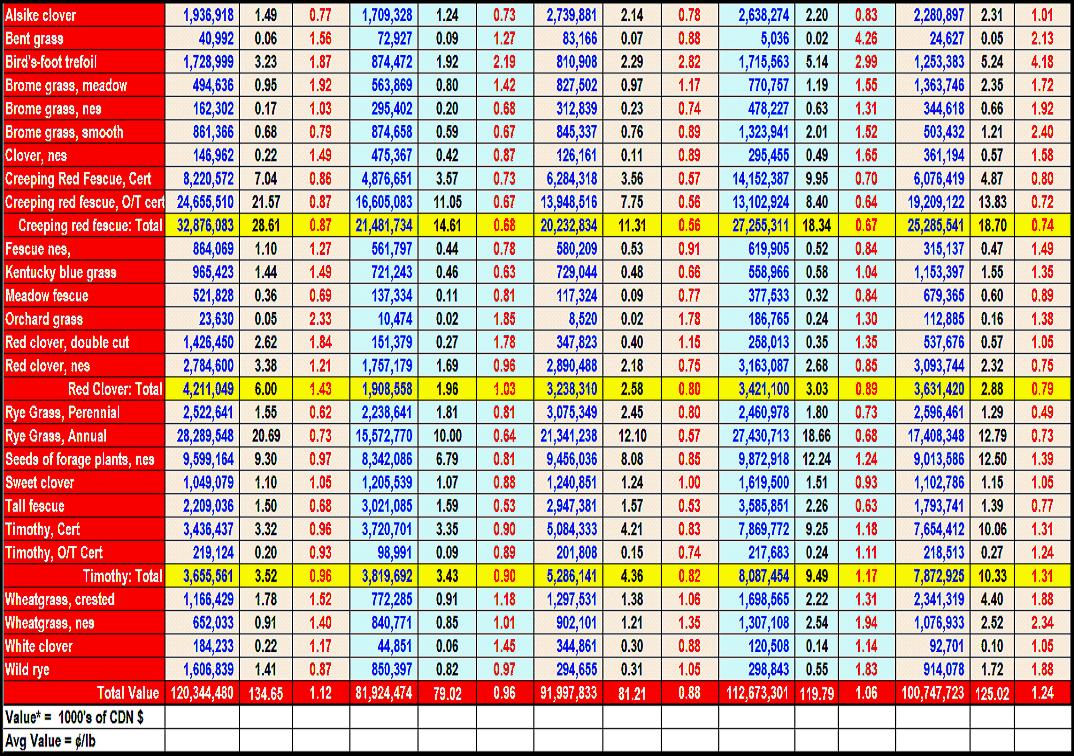
- The “Queen of the legumes”, alfalfa, continues to hold the #1 position in terms of value to the Canadian grass and legume seed export industry. Of the total Canadian value of Grass and legume seed exports in 2012/13 ($125 million), alfalfa seed accounted for $40.1 million. Even if alfalfa seed export value was broken out between certified and common seed, both amounts would rank 1st and 2nd. However, the distinction of highest valued crop, on a per lb. basis, belongs to birds-foot trefoil, which showed an average export value of $4.18/lb.
|
|
- Creeping red fescue exports resulted in $18.7 million in value in 2012/13. Although 2 million less lbs. were exported than the previous year, the higher prices paid for this past year’s crop resulted in higher overall returns. (2011/12 = $18.3 million in exports). The average export price (73.9 �/lb.) was up for the third year in a row (10/11 = 55.9 �/lb., 11/12 = 67.3 �/lb.).
- Perennial ryegrass seed exports accounted for $12.79 million in 2012/13. Average export prices were at 73.5 �/lb. Total export value of perennial ryegrass dropped $6 million from the previous year, although the price per lb. increased by 5.5�.
- Timothy seed exports were able to crack the $10 million mark ($10.33 million) for the first time since 2000/01, with the average trade value of $1.31/lb. being the highest in at least the past 11 years. Please see note below under USA.
Table 2: Canadian Grass and Legume Seed Exports, by Species, Amount and Value
Note: The USA does not recognize Timothy seed as a trade code, so timothy seed exported to the USA from Canada is labeled under “seeds of forage plants, not elsewhere specified”.
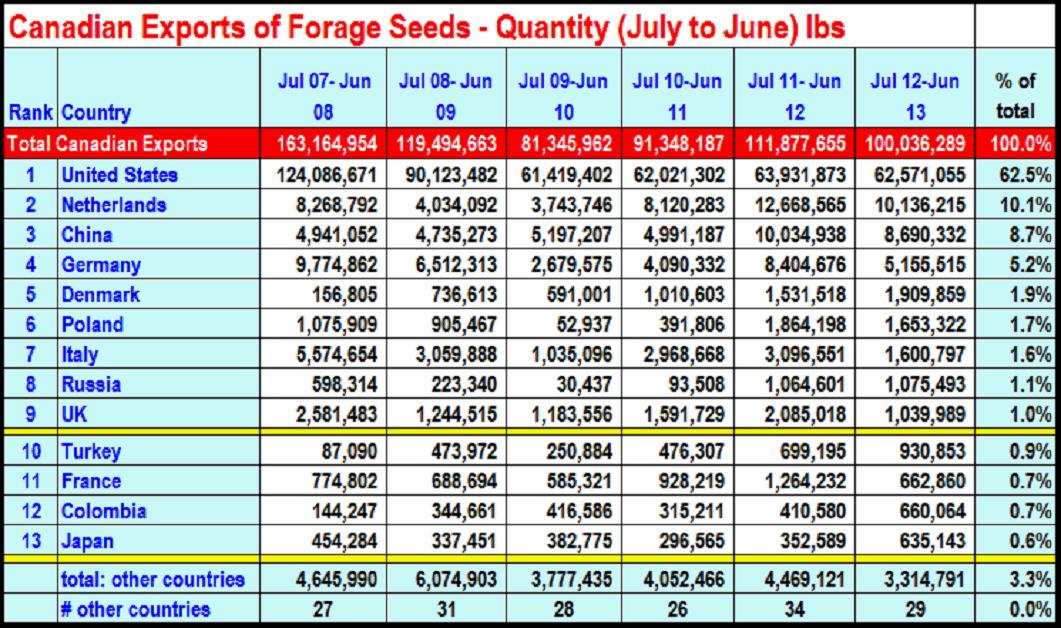
Canadian Grass and Legume Seed Exports by Destination
- The USA remains the No. 1 destination for Canadian grass and legume seed, with over 62% of Canadian exports (62.5 million lbs.)
- 8 other countries imported more than 1 million lbs. of Canadian seed, with those countries being:
- Netherlands – 10.1 million lbs
- China – 8.7 million lbs.
- Germany – 5.1 million lbs.
- Denmark – 1.9 million lbs.
- Poland – 1.6 million lbs.
- Italy – 1.6 million lbs.
- Russia – 1.1 million lbs.
- United Kingdom – 1.0 million lbs.
|  |
- Italy, which imported over 3 million lbs. of seed the previous year, saw her imports drop to 1.6 million lbs. in 12/13. (10 yr. avg. Canadian annual exports to Italy = 2.01 million lbs.)
- Canadian exports to the United Kingdom, although still above 1.0 million lbs., fell over 50%.
- In 2012/13, Canada exported grass and legume seed to 42 different nations worldwide
- 4 other countries imported over 500,000 lbs. of Canadian grass and legume seed (Turkey, France, Columbia, and Japan).
- In addition to the above 13 countries, the remaining 29 countries Canada exported seed to only accounted for 3.3 million lbs.. (3.3% of Canadian exports).
Table 3: Canadian Grass and Legume Seed Exports by Destination (lbs.)
United States
- The USA imported 62.5% of total Canadian grass and legume seed exports in 2012/13. This was up by over 5% from the previous year.
- Common creeping red fescue seed is the number one imported crop by volume, with 18.4 million lbs. (96.7%) imported by the USA last year
- Compared to common creeping red fescue seed, the USA only imported 3 million lbs. (50.7% of Canadian certified creeper exports)
- Exports of perennial ryegrass seed to the USA continues to fall, with only 47.4% (8.2 million lbs.) entering the USA last year, and marks at least the 5th year in a row that the USA has taken a smaller portion of Canada’s perennial ryegrass seed crop. Since 2008/09 (23 million lbs. imported by the USA, = 82.2%), the % of Canada’s perennial crop exported has fallen constantly (09/10 = 69.5%, 10/11 = 66.7%, 11/12 = 50.8%)
|  |
- The USA remains a primary destination for Canadian alfalfa seed, with 86% of common seed (8 million lbs.) and 50.1% of certified alfalfa (4.9 million lbs.) landing in the USA.
- For the 2nd year in a row, exports of meadow bromegrass seed to the USA increased, with 2012/13 seeing 938,000 lbs. exported, compared to 560,000 and 270,000 lbs. exported the two previous years.
- With the devastating drought in the US mid-west in 2012, and subsequent poor smooth bromegrass seed crop in Kansas, 2012/13 saw 82.9% of Canadian smooth bromegrass seed exported to the USA (414,000 lbs.). However, this was down by 600,000 lbs. from 2011/12, as Canadian production has shifted into more annual crop production.
- Crested wheatgrass seed exports to the USA saw the most dramatic changes from 2011/12. Not only did imports increase three and a half times (from 650,000 lbs. to 2.3 million lbs..), the USA took almost all of Canadian exports (99.9%). In 2011/12, only 38.5% of Canadian exports landed in the USA.
- In total, the USA accounted for $80 million of Canada’s total exports of $125 million
Note: USA customs does not recognize the trade code for timothy seed, therefore Canadian exports of timothy, both common and certified, is classified as “seeds of forages, NES (not elsewhere specified). This will undoubtedly lower actual Canadian “timothy seed” exports, but the actual exported seed has been accounted for.
The Netherlands
- The Netherlands accounted for 10.1% of Canadian exports ($12.6 million)
- Dutch imports in 12/13 dropped 2.5 million lbs. compared to the previous year, but the value of the seed increased by $210,000.
- Certified timothy seed accounted for 3.9 million lbs., followed by perennial ryegrass (2.25 million lbs.) and certified alfalfa (1.1 million lbs.). 1 million more lbs. of timothy was imported in 2012/13 than the previous year.
- Red clover seed imports from Canada dropped by over 50%, with 400,000 lbs. imported last year, compared to 950,000 lbs. the previous year.
- With competition from the USA for Canadian smooth bromegrass seed, only 4,000 lbs. was imported in 2012/13, compared to over 52,000 lbs. the previous year.
- Canadian creeping red fescue imports fell from 2.1 million lbs. to 430,000 lbs.
China
- Chinese imports of Canadian grass and legume seed totaled 8.7 million lbs. in 2012/13, down by 1.3 million lbs. from the previous year.
- Although the quantity of seed fell, the value ($10.7 million) increased (2011/12 = $10 million)
- Perennial ryegrass seed (3.9 million lbs.) accounted for 44% of Chinese imports from Canada. This though, was down by almost 1 million lbs. from 2012/13.
- Besides perennial ryegrass imports, only alfalfa seed saw more than 1 million lbs. imported (2.4 million lbs.), up by almost 700,000 lbs. from 2012/13.
- Red clover seed ranked as the 3rd most imported crop, with 730,000 lbs. imported. This was the 3rd year in a row in which red clover seed imports increased.
- Crested wheatgrass imports dropped dramatically to just 2,000 lbs., compared to 950,000 lbs. imported the previous year.
| 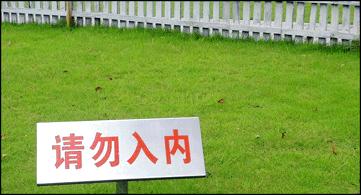
New lawn grass, Shanghai China |
Germany
- German imports of Canadian grass and legume seed fell 39% last year, with exports dropping from 8.4 million lbs. to 5.1 million
- Imports of creeping red fescue dropped by 1.2 million lbs.., with timothy (.9 million lb.. decrease) and perennial ryegrass (1.2 million lb.. decrease) following suit. Imports of these 3 crops totaled 960,000 lbs., 1.5 million lbs. and 850,000 lbs. respectively.
- However, red clover imports from Canada jumped from 100,000 lbs. (11/12) to 620,000 lbs
Denmark
- Danish imports of Canadian grass/legume seed (1.9 million lbs.) increased for the 3rd year in a row, tripling in tonnage from 2009/10 (591,000 lbs.)
- Denmark, which is one of the worlds’ top grass and legume producing nations, only imported 4 different species from Canada, those being: alfalfa seed (625,000 lbs.), timothy seed (616,000 lbs.), perennial ryegrass (595,000 lbs.) and some alsike clover (53,000 lbs.)
- The value of Canadian grass and legume seed imports to Denmark increased 71%, and 2012/13 saw imports worth $2.4 million enter from Canada.
Summary
Until Canadian farmers start diversifying their farming operations, and dedicate land to the production of grass and legume seed crops, Canadian grass and legume seed production will continue to drop. Continued good returns for traditional annual crops (wheat, canola, barley etc.) will limit acres in forthcoming years. Acres of new grass and legume seed crops continue to fall, and on-farm inventories have been depleted the past few years. Continued high prices for grass and legume seed MAY entice more acres, but until that occurs, expect Canadian production, and her subsequent reliance on exports in this sector, to continue to fall. The seed just isn’t there.
Prepared by David Wong, Market Specialist,Alberta Agriculture & Rural Development, Ag-Info Centre 310-3276
E-mail: david.k.wong@gov.ab.ca
|
|