| Introduction | Fertility management | Soil test criteria | Soil type characteristics | Copper deficiency symptoms | Copper fertilizers | Conclusion| References
Introduction
Over 20 years of copper (Cu) fertility research in central Alberta has led to the identification and confident correction of Cu deficiencies once field diagnoses have been made. A good understanding of the management of the many available Cu fertilizers allows for recommendations for rates, methods and timing of Cu fertilizer applications.
Unfortunately, the correct diagnoses of Cu deficiency in the field are often not made with confidence and producers are experiencing:
- reduced yield and quality when Cu fertilizer is required but not applied
- unnecessary applications of relatively expensive Cu fertilizer when soil levels are adequate
The understanding of Cu fertility has changed dramatically, especially in recent years. Prior to the mid 1980s, agronomists in Alberta thought Cu deficiencies were limited to only some deep organic soils (>45 cm.) and Cu deficiency did not affect crops growing on mineral soils.
Research has now identified Cu deficiencies in the Black, transitional Gray-Black and Dark Brown soil zones. The extent of the deficiencies on these soils is not well defined, but it is estimated that approximately three million acres are significantly Cu deficient.
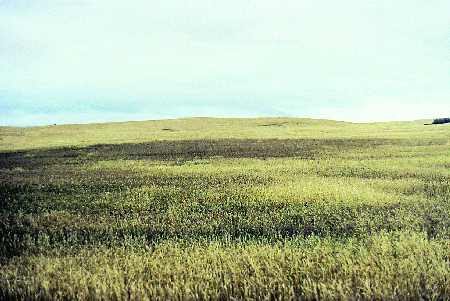
Figure 1. Copper deficient (melanotic) "patch" in Park wheat.
These three million acres represent about fifteen per cent of Alberta's cultivated acreage, much of it found within the most productive agroclimatic zones of Alberta. Under optimum fertility conditions (high nitrogen and phospherous), perhaps as much as another three or more million acres would be deficient for sensitive crops, such as, wheat (Figure 2). Why the big change in thinking?
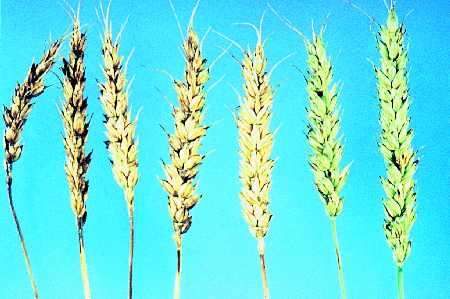
Figure 2. Heads of wheat grown in copper deficient soil become bleached and then turn grey; stems of some cultivars darken significantly due to melanosis.
Prior to 1985-88, the sole criteria for determining whether a soil was Cu deficient or not was the critical level of 0.2 ppm DTPA extractable Cu. In other words, if a soil test indicated more than 0.2 ppm Diethylenetriaminepentaaceticacid (DTPA) extractable Cu, then the soil was determined to have sufficient Cu for normal crop growth. This approach did not distinguish between those crops with high Cu needs, such as wheat and barley, and those that could still give optimal yields at very low Cu levels, such as canola and rye.
However, research on Cu deficiencies on mineral soils in Saskatchewan showed that the level of 0.2 ppm DTPA extractable Cu, used at the time, was too low and should be increased to 0.4 ppm for Saskatchewan cereals. Additional research on copper deficiency on central Alberta soils that tested 0.6 to 0.8 ppm DTPA extractable Cu showed that the critical level should be moved up even further.
Twelve years of research have clearly shown that there is a low probability of correctly diagnosing Cu deficiency if only soil test DTPA extractable Cu is considered.
The probability of correct diagnosis increases dramatically if overall fertility management, soil type, herbicide used, livestock manure, delayed crop maturity, soil copper profile and past observations of copper induced disease, particularly ergot (Table 5), or some of the many Cu deficiency symptoms common in wheat and barley are taken into account (Figure 3).
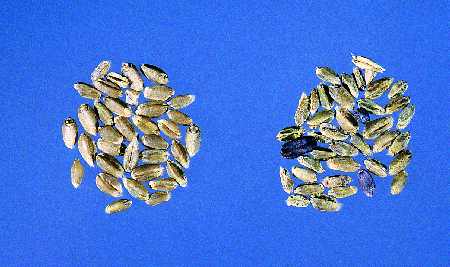
Figure 3. Left - normal wheat. Right - shrivelled wheat kernels (frosted bran) and ergots due to a copper deficiency.
Fertility Management
Producers who do not manage their fertility at an optimally high level usually have yields that are limited by nitrogen (N), phosphorus (P), potassium (K) or sulphur (S) before Cu can affect yields. Managers striving for optimal yields are generally the first to observe Cu deficiency in a farming area. Their fertility management often includes manure and above average rates of fertilizer. In many instances, their first indications of Cu deficiency are crop yields or bushel weights consistently below their expectations.
Results presented in Table 1 are typical of the initial experience many producers have with Cu deficiency. In this situation, the farmer had been applying optimal rates of fertilizer and manure every three to five years. Yields, quality and weed control were disappointing, and many agronomists had given several different reasons why yields were lower than expected. With the application of Cu, crop quality and yield both improved dramatically.
Table 1. Effect of copper fertilizer on yield and kernel plumpness of wheat and barley (1989).
| Crop | Copper Rate*
(lb Cu/ac) | Yield
(bu/ac) | % Kernel
Plumpness |
| Klages Barley | 0 | 62 | 48 |
 | 10** | 92 | 82 |
| Park Wheat | 0 | 15 | 59 |
| 10 | 36 | 72 |
* Copper applied at 10 lb Cu/ac as Copper Sulphate (Bluestone) in 1987
** High rates give an instant response. Lower Cu rates (2 - 3 lbs) may be sufficient for optimum yield but take several years to achieve their full effect.
Other indications of Cu deficiency include consistently low bushel weights, especially in barley, and high protein (>18%). A lack of Cu hinders the movement of carbohydrates to form starch in the maturing grain head. Hence, shriveled grain, low bushel weight and concentrated protein result since there is relatively little starch present (Figures 4 and 5).
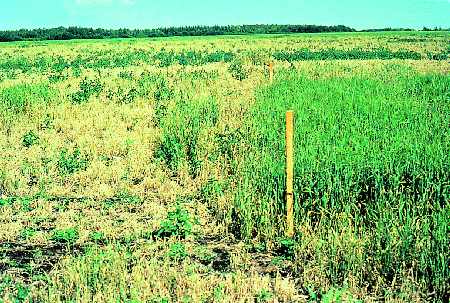
Figure 4. Dead barley at left is due to severe copper deficiency. Barley at right will mature on peat soil since copper fertilizer was applied.
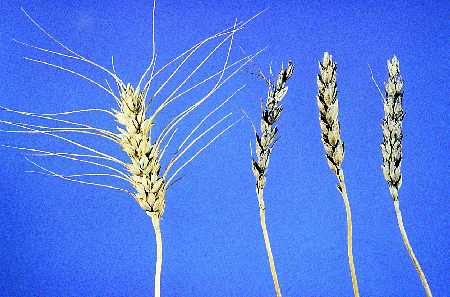
Figure 5. Left - normal wheat. Right - wheat with severe copper deficiency symptoms.
Soil Test Criteria
The soil test criteria for diagnosing Cu deficiency have been further modified for Alberta growing conditions (Table 2). When soil tests are in the marginal range, crops should be carefully observed for symptoms of Cu deficiency (Table 3), and Cu fertilization should be tried on test strips.
Fields with a history of heavy manure application and/or optimal NPKS fertilizer management (high yield potential) may respond strongly to Cu fertilizer, even when the soil test is well above 0.6 mg/kg because of variable distribution. Optimal Cu levels in Australia are 1.5 ppm and higher in the United Kingdom for wheat production.
Table 2. Soil copper levels for mineral soil diagnosis. DTPA extractable. 0 - 6" depth.
| DTPA Cu (ppm) | Interpretation |
| < 0.4 | Deficient |
| 0.4 - 0.6 | Marginal |
| 0.6 - 1.0 | Deficient in some instances |
| > 1.0 | Usually Adequate* |
* In fields of high variability, where the copper may range from 0.2 to 2 ppm with a mean of 1 ppm, up to 50 per cent of the land could be deficient and therefore responsive to applied copper, particularly when growing wheat or barley. Running a 20 ft. (6 m) strip of copper fertilizer at a 10 lb actual copper per acre rate in a diagonal across the field, which likely has variable copper levels, will show up "sufficient" and "deficient" areas in succeeding wheat and barley crops (Figures 6 and 7).
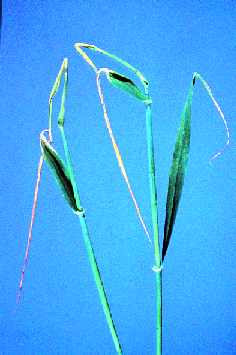
Figure 6. Pigtail (whip-tail) of barley shows copper deficiency.
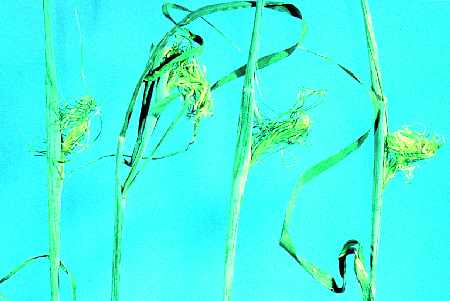
Figure 7. Copper deficiency in barley causes symptoms similar to herbicide injury.
Table 3. Copper deficiency symptoms in cereals
| Symptoms | Degree of Deficiency |
| Slight | Moderate | Severe |
| Limpness or wilting at mid-tillering | | | x |
| Limpness or wilting at mid-tillering at stem elongation | x | x | |
| Pale yellow, curled young leaves at tillering | | | x |
| Pig tailing (Whip tailing) - leaf tip dies and may roll and turn white, sometimes appearing fibrous. Upper 1/3 to 1/2 of the leaf may wither and break abruptly at the healthy part. | | x | x |
| Increased susceptibility to disease | | x | x |
| Presence of ergots in grain heads, specifically wheat and barley. | x | x | x |
| Unusually high levels of take-all or "take-all" like symptoms in wheat. | x | x | x |
| Retarded stem elongation | | x | x |
| Excessive late tillering and high mortality of late tillers. | | x | x |
| Delay in heading - Non-uniform heading occurs, particularly on light loamy soils where crop emergence and early development is uniform. | | x | x |
| Aborted heads and spikelets. | | | x |
Heads and spikes are nearly normal, but contain many empty spikelets.
Anthesis is poor and late. Grain is shrivelled and endosperm is blackened. | | x | x |
| Delay in maturity and senescence - Maturity may be delayed for a few days to several weeks. | x | x | x |
| Head and stem bending - stem may break 15 to 30 cm below the head. | x | x | |
| Stem and head melanosis of wheat - Dark brown patches that usually begin at the milky dough stage. Dark purplish brown colour (melanism) appears on head and/or upper stem and/or lower stem. | x | x | x |
| Probable loss in grain yield (%) | 5 - 20 | 20 - 50 | 50 - 100 |
| Probable loss in straw yield (%) | nil | 1 - 10 | 10 - 20 |
Adapted from Graham and Manbiar, 1981
Soil Type Characteristics
Copper deficient soils have several characteristics that indicate where a deficiency will likely occur:
Texture
Deep sandy and light loamy soils are much more likely to be Cu deficient than medium or heavy textured soils. The parent material forming these soils may contain low Cu concentrations.
Organic matter
Cu is strongly bound to organic matter. As organic matter increases, the probability of Cu deficiency increases. Manure and straw from previous crops can also tie up Cu.
Soil pH
Copper availability is reduced as pH increases. A pH increase of 1 unit (between pH7 and 8) means a 100-fold reduction in Cu availability to the crop. Thus, for similar soils, as pH increases so does the probability of Cu deficiency.
Other soil nutrients
High soil test values for phosphate (P205) and N are often associated with Cu deficient soils in Alberta. High N levels delay the translocation of Cu from older leaves to the growing points or may tie up the Cu in protein-like compounds in the roots, thus contributing to Cu deficiency. High levels of P205, Zinc (Zn), Iron (Fe), Manganese (Mn) and Al restrict or compete with Cu absorption by cereal roots.
Soil copper profile: Soil copper profiles that remain low or decrease with depth are much more likely to respond to additions of Cu fertilizer than soils that have soil Cu levels that increase with depth (Figure 8). To make a correct diagnosis, sample soil to at least 1 foot (30 cm), preferably 2 feet (60 cm).
Looking at the example below, note that the probability of a Cu response is much greater with profile (a) than with (b). Deep sampling for micronutrients like Cu will only need to be done every 5 to 10 years.
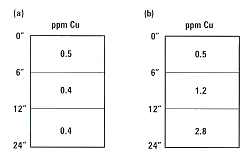
Figure 8. Generalized soil Cu profiles typically found in Alberta.
In wet springs followed by very dry conditions resulting in shallow rooting of cereal crops, profile (b) above may be as deficient as profile (a). In dry seasons, no deficiency may show up on profile (b) due to deep rooting into subsoil sufficient in available copper.
Copper Deficiency Symptoms
Cu deficiency in cereals produces characteristic disease symptoms that may be similar among cereal crops. However, crops growing on marginally Cu deficient soils may have losses of 20 per cent or more in grain yield while not showing any typical visual symptoms of copper deficiency.
Crop maturity can also be delayed by 7 - 14 days, resulting in greater foliar disease instances and a much greater risk of frost injury to the maturing grain.
Visual symptoms of Cu deficiency (Table 3) are commonly observed in fields of wheat, barley and occasionally in oats. Many of these disease symptoms may be confused with other nutrient deficiencies (N, P, K, or S), frost damage, insect damage, infectious diseases and herbicide damage.
Herbicides are commonly blamed for yield losses because Cu deficiency symptoms usually show up about the same time that post-emergent herbicides are applied. Some post-emergent herbicides however enhance Cu deficiency (or delay crop maturity). See Figure 9.
Interestingly, this year (1999), nickel (Ni) has been shown to be essential for cereal crops. Under nickel deficient conditions, barley plants fail to produce viable grain.
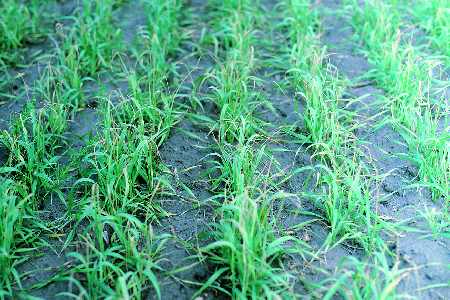
Figure 9. Herbicide wheat interaction (leaf tip burning) on copper deficient soil.
Deficiency symptoms usually occur in irregular patches and are most obvious in mature wheat stands that express Cu deficiency primarily as melanism or purplish brown patches (e.g. cultivars Park and Roblin). Other varieties show Cu deficiency primarily as take-all like symptoms (Table 4), which adds further confusion to Cu diagnoses (e.g. cultivars Oslo and Laura). In many instances, copper fertilizer applied to copper-deficient wheat or barley resulted in crops maturing seven to fourteen days sooner.
Table 4. Copper reduces ""take-all"" like disease symptoms and melanosis in spring wheat cultivars (1993). Soil test 0.6 ppm DTPA extractable Cu, Stony Plain, Alberta.
| Cultivar | % Take-all | Melanosis |
+Cu* | -Cu | +Cu | -Cu |
| Roblin | 4** | 70** | None | Slight to severe |
| Park | 6 | 78 | None | Slight to severe |
| Oslo | 12 | 69 | None | None |
| Laura | 4 | 52 | None | None |
* Copper applied at 10 lb. Cu/ac, in 1993, as copper sulphate (Bluestone).
** Actual take-all was around 4% - 12%, whereas take-all-like symptoms (above ground) exceeded 70%.
Table 5. Effect of copper fertilization on ergot infection of Park wheat (1989). Soil test 0.6 ppm DTPA extractable Cu, Stony Plain, Alberta.
Cu Rate*
(lb/ac) | Grain yield
(bu/ac) | Ergots
(number/yard2) |
0 | 13 | 11 |
10 | 43 | 2 |
* Copper applied at 10 lb Cu/ac, in 1987, as copper sulphate (Bluestone)
For grain crops, the usual order of sensitivity (response) to Cu deficiency is winter wheat>spring wheat>flax> barley>oats>peas>triticale>rye. Canola has not shown Cu deficiency symptoms or responded to Cu fertilizer additions when grown on soils considered very copper deficient for wheat or barley. Many other Alberta crops have yet to be evaluated for their sensitivity (response) to Cu nutrition (Figures 10 and 11).
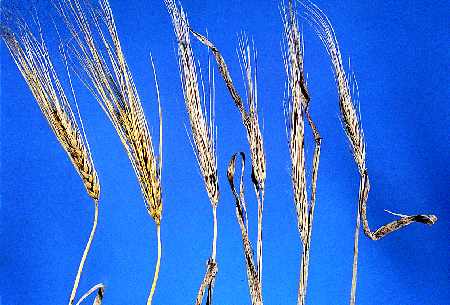
Figure 10. Left - normal barley. Right - severe copper deficiency.
Figure 11. Severe herbicide/low soil copper interaction on wheat - unsprayed wheat in the background.
Copper Fertilizers
Both soil and foliar applications of copper fertilizer are effective for overcoming copper deficiencies (Tables 6 and 7).
Soil applications are more common because a single application can be effective for many years. A foliar application will correct a deficiency if applied during the late tillering stage, but only for that season.
Table 6. Effect of copper fertilizer on yield and kernel plumpness of Park wheat and Klages barley (1989).
| Crop | Copper
treatment | Yield
(bu/acre) | Kernel
plumpness (%) |
| Barley | no copper | 62 | 48 |
| copper | 92 | 82 |
| Wheat | no copper | 15 | 59 |
| copper | 36 | 72 |
* Copper sulphate applied at 10 lb of actual copper per acre.
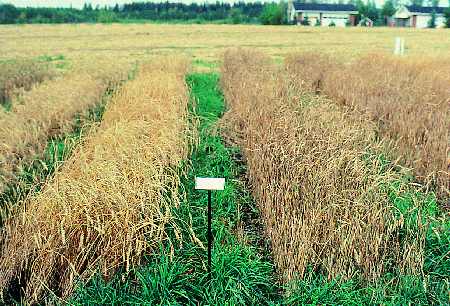
Figure 12. upright (empty-headed) Park wheat at right is grown on 0.6 ppm (DTPA Cu) soil. At left, same crop grown on soil amended with 12 lb Cu/ac as CuSO4. Yields were 19 bu/ac vs 51 bu/ac. Almost a triple yield increase and a quality jump from Sample to #1.
The availability of soil-applied copper is improved when:
- the fertilizer applied is soluable (e.g. copper sulphate). Most other copper fertilizers are poorly soluable.
- the particle size of the fertilizer is small, thereby increasing the number of granules or droplets per soil volume.
- the fertilizer is thoroughly mixed into the rooting zone. Fall application allows deeper and more thorough incorporation than spring application.
Table 7. Park wheat response to copper fertilization near Tofield, Alberta.1
| Method of
copper application | Yield bu/acre
3 yr. Avg. |
| Control | | 44 |
| Copper chelate | soil spray | 59 |
| Copper sulphate | seed-row | 56 |
| Copper sulphate | band | 50 |
| Copper sulphate | broadcast | 60 |
1 One-time application of Cu chelate (1 lb Cu/acre as Cu-EDTA) and Cu sulphate (3 lb Cu/acre as Cu sulphate).
Foliar applications are most effective and immediate at the late tillering stage. If the deficiency is severe, two applications (mid-tillering and early boot stage) may be required. A copper deficiency may reappear at the head filling stage after early foliar applications. If foliar copper is applied at anthesis (flowering) or later, there may be an actual yield decrease, perhaps related to this micronutrient's ability to speed up cereal crop maturity.
Yield response may also not occur to copper fertilizers when they are first applied if the subsequent growing season is dry. Copper does not move in the soil and may remain in the dry surface layers. Minimum or zero till producers on copper deficient land should consider thorough cultivation to uniformly incorporate copper fertilizer into their soils.
Copper sulphate
Copper sulphate, also known as bluestone, is generally the least expensive source of copper. It contains 25 per cent copper and should be broadcast and incorporated into the soil at rates of 10 to 40 pounds per acre (2.5 to 10 lb/ac of copper). These application rates have been effective for at least 10 - 15 years in Australia. Copper sulphate is available as a fine or course crystalized material. It tends to accumulate moisture and is difficult to blend with other fertilizers. Granular herbicide applicators have been used with some success for direct application of copper sulphate.
Copper sulphate can also be dissolved in water and sprayed on the soil surface or as a foliar application. A 2 per cent solution, sometimes buffered with calcium hydroxide, is used for foliar application. Foliar application rates range from 0.1 to 0.3 lb/acre actual copper.
Caution
Copper sulphate is highly corrosive when it comes into contact with metals. Stainless steel and plastic components are required on fertilizer applicators and sprayers. Copper sulphate dust can severely irritate the eyes, lungs and skin.
Copper chelates
Copper chelate solutions contain 5 to 7.5 per cent copper for soil and foliar application. For soil application, copper chelates are applied at about 10 per cent of the rate of copper sulphate but the period of residual response is much shorter. The rates for foliar applications are similar to those for copper sulphate. There are several manufacturers of liquid copper chelates. Chelated copper is also available in a granular form. When using this source, at least 1 lb of copper should be applied per acre.
Granular copper fertilizers
The 15/10 or 20/10 are non-corrosive (copper oxide, copper oxysulphates) granular products blendable with fertilizers but poorly soluable. They contain 15 - 20 per cent copper and 10 per cent zinc.
Table 8. Responses of various crops to copper fertilizer on copper-deficient soils
| Crop | Response |
| Wheat | High |
| Flax | High |
| Canary seed | High |
| Barley | Medium-high |
| Alfalfa | Medium-high |
| Timothy seed | Medium |
| Oats | Medium |
| Corn | Medium |
| Peas | Low-medium |
| Clovers | Low-medium |
| Canola | Low |
| Rye | Low |
| Forage grasses (hay) | Low |
Source: Department of Soil Science, Faculty of Agriculture, University of Manitoba
Conclusion
Confident diagnoses of Cu deficiency require much more than a simple scan of laboratory results from a 0-6" soil sample. Agronomists and producers need to consider the following questions:
1. Is the soil coarse-textured?
2. Is the topsoil rather deep (>12 in. or 30 cm)
3. Does the soil have a high level of organic matter (>6 %)?
4. Does the soil Cu profile remain low or decrease with depth (<1.0 mg/kg)?
5. Does the soil test indicate relatively high levels of available P2O5 and/or N?
6. Does the farmer strive for above-average yields?
7. Are crop yields consistently below expectation?
8. Is the quality of grain consistently poor, usually with shriveled or thin kernels and/or light bushel weights?
9. Does the grain often have very high protein levels (>18%)?
10. Is there a history of manure application?
11. When cropped to wheat or barley, have unusual patches appeared?
12. Have these patches been diagnosed by several "experts"? Many with different answers?
13. Do these patches contain unusually high levels of disease in some years?
14. Is ergot a problem in wheat or barley?
15. Have there been instances of unusually severe herbicide injury?
The greater the number of "YES" answers to these questions, the greater the confidence in correctly diagnosing a Cu deficiency.
Cu deficiencies exist across the Canadian prairies in particular as well as south into the adjoining American states.
Crop yield and quality losses in Alberta alone in both wheat and barley has run into tens of millions of dollars annually. Copper deficiency is a simple problem that can be corrected in most instances with a single application of granular copper-based fertilizer. The effects of this single application can last for up to 10 years or more.
Foliar applications of copper fertilizer have to be applied annually to cereal crops growing on copper deficient land.
Thousands of provincial producers from Fort Vermillion to Milk River have now seen modest to spectacular yield and quality gains from copper applications on their wheat and barley crops.
Prepared by:
Elston Solberg, Ieuan Evans, Doug Penny,
Alberta Agriculture, Edmonton, Agronomy Unit
Plant Industry Division
Tel: (780) 427-7098
References
Graham, R.D. and E.K.S. Nambiar. 1981. "Advances in research on copper deficiency in cereals." Aust. J. Agric. Res. 32.1009-37.
Lindsay, W L., and W.A. Norvell. 1978. "Development of a DTPA soil test for zinc, iron, manganese and copper." Soil Sci. Soc. Am. J. 42:42~-428.
Penney, D.C., E.D. Solberg, I.R. Evans, and L.J. Piening. 1988. "The copper fertility of Alberta soils." Great Plains Soil Fertility Workshop Proceedings, Vol.2 Kansas State University. Manhatten, KS 66506.
Source: Agdex 532-3. September 1999. |