| | Introduction | Corn, soybeans, barley, and oats | Wheat | Market noise | Exporting to the US | Return to Marketing Risk Management home page
Introduction
The United States is a market leader in many of the world's major crops. Understanding where and when major US crops are grown can help Canadian farmers market their crops. Reports on US seeded acreage, growing conditions, weather forecasts, production reports, and harvest progress are all relevant for Canadian farmers. Some reports, particularly in farm papers, are interesting news but they have little market significance. Other reports are very important. Knowing where the various crops are grown can help separate important market news from "market noise".
This article will show where each of the major US crops is grown. It will also show when the crops are planted, when they are in their reproductive state, and when they are harvested.
Corn, Soybeans, Barley, and Oats
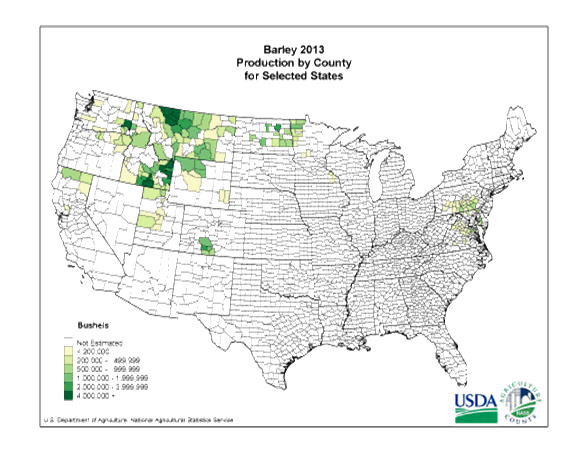
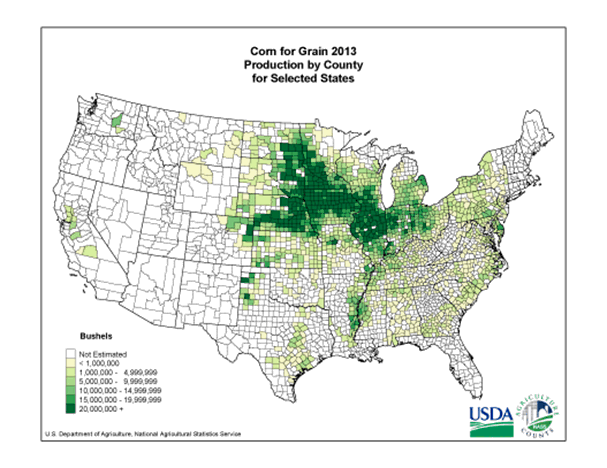
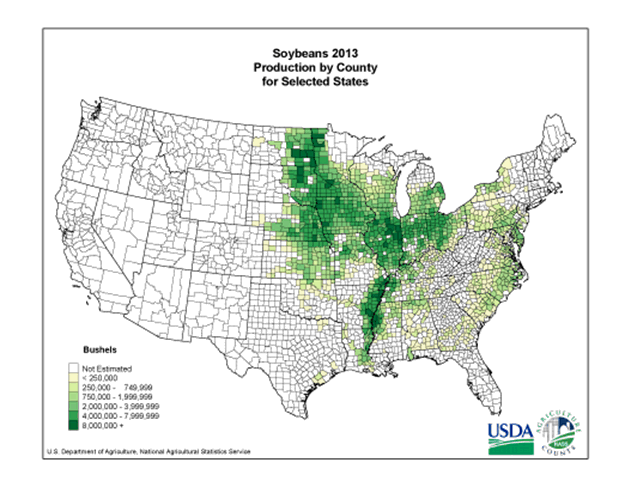
The largest US crop in terms of total production is corn, the majority of which is grown in a region known as the “corn belt”. The second largest crop grown in the US is soybeans. As with corn, soybeans are primarily grown in the Midwestern states. The US barley crop is of most interest to Canadian malt barley growers. US barley is grown over a wide area geographically and the US produces about 60 per cent as much barley as Canada. Although the US produces some oats, Canada is the world’s largest oat exporter and supplies about 70% of the oats imported into the US. Figure 1 and Table 1 show the average annual production of each crop in the US, where they are grown, when they are seeded, when the crop flowers or heads, and when it is harvested.
Table 1 Crop production in the United States
| Crop | Average annual production 2008-2012 | Primary growing
areas | Seeding | Flowering or heading | Harvesting |
| Corn | 12 billion bushels | Iowa | April and | July through | Oct and Nov |
 |  | Illinois | May | first half of |  |
 |  | Nebraska |  | Aug |  |
 |  | Indiana |  |  |  |
 |  | Minnesota |  |  |  |
 |  | Ohio |  |  |  |
| Soybeans | 3 billion bushels | Illinois | May and | July through | Late Sept |
 |  | Iowa | June | first 3 weeks | through Oct |
 |  | Minnesota |  | of Aug |  |
 |  | Indiana |  |  |  |
 |  | Ohio |  |  |  |
| Barley | 205 million bushels | North Dakota | April and | July through | Late July to |
 |  | Montana | May | first half of | end of Sept |
 |  | Washington |  | Aug |  |
 |  | Idaho |  |  |  |
| Oats | 76 million bushels | Iowa | April and | July through | Aug and |
 |  | Minnesota | May | first half of | Sept |
 |  | South Dakota |  | Aug |  |
 |  | North Dakota |  |  |  |
 |  | Wisconsin |  |  |  |
Source: USDA 2013 (http://www.nass.usda.gov/Statistics_by_Subject/index.php); USDA 2010
Figure 1. US Corn, Soybeans, and Barley Production by County


Source: USDA 2010
Wheat
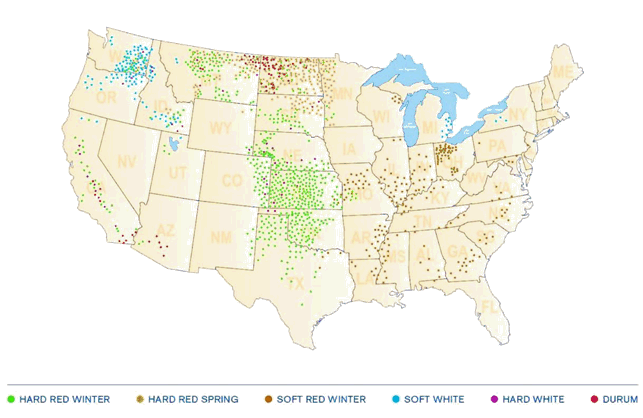
The third largest crop grown in the United States is wheat. The US produces hard red, soft red, and white winter wheats and hard red and durum spring-seeded varieties. The US also produces very small amounts of white spring wheat. Table 2 and Figure 2 show the primary growing areas for each type of wheat, including the average seeding, heading, and harvesting dates.
Table 2 Wheat Production in the United States
Type of
wheat | Average annual production 2008-2013 | Primary growing areas | Seeding | Heading | Harvesting |
| Hard red | 951 million bushels | Kansas | Late Aug to | The following | Late Aug to |
| winter |  | Colorado | end of Oct | year from late | end of Oct |
| wheat |  | Oklahoma |  | April through |  |
 |  | Texas |  | early June |  |
| Hard red | 506 million bushels | North Dakota | April to May | Mid-June to | Mid-July to |
| spring |  | South Dakota |  | mid-July | Mid-Sept |
| wheat |  | Montana |  |  |  |
| Soft red | 426 million bushels | Indiana | Late Sept to | the following | Late Aug to |
| winter |  | Ohio | end of Oct | year from late | end of Oct |
| wheat |  | Illinois |  | April through |  |
 |  | N. Carolina |  | early June |  |
 |  | Arkansas |  |  |  |
 |  | Tennessee |  |  |  |
| Soft white | 209 million bushels | Washington | Early Sept | The following | Mid-July to |
| winter |  | Oregon | to mid-Nov | year from mid- | early Sept |
| wheat |  | Southern Idaho |  | May to end of |  |
 |  |  |  | June |  |
| Durum | 86 million bushels | WisconsinNorth Dakota | April to May | Mid June to | Mid-July to |
| wheat |  | Eastern |  | mid-July | mid-Sept |
 |  | Montana |  |  |  |
 |  | South Dakota |  |  |  |
| Hard white | 16 million bushels | Kansas | Late Aug to | The following | Late Aug to |
| winter |  | Colorado | end of Oct | year from late | end of Oct |
| wheat |  |  |  | April through |  |
 |  |  |  | early June |  |
Source: USDA 2013 (http://www.nass.usda.gov/Statistics_by_Subject/index.php);
Figure 2 Wheat Production Areas in the United States

Source: National Association of Wheat Growers 2013 (http://www.wheatworld.org/wp-content/uploads/about-wheat-production-by-class-20110606.jpg).
Market Noise
The goal of this Agricultural Marketing Manual is to help farmers to decide what is "market noise" and what is market news. For example, if you hear a report that says that the corn crop in Texas is suffering from severe drought, you will know that is "market noise" rather than significant market news. Texas doesn't produce a great deal of corn. Or if you hear that the soybean crop in northern Alabama has been damaged by a frost, you'll know that is "market noise".
Exporting to the US
If you’re interested in exporting to the US, see “Exporting Grain, Oilseeds and Special Crops to the United States” on our YouTube channel: http://www.youtube.com/watch?v=5bvCmjWYyf0&list=PLOUwfF01x2YU5pMx-R370Wu72rb9wsTJN&index=2 |
|