| |

The 2016 crop season | Insects and crop diseases | Pasture and forage | Alberta crop production, 2016 | Alberta forage production, 2016 | Alberta crop production tables | Precipitation map
Overview
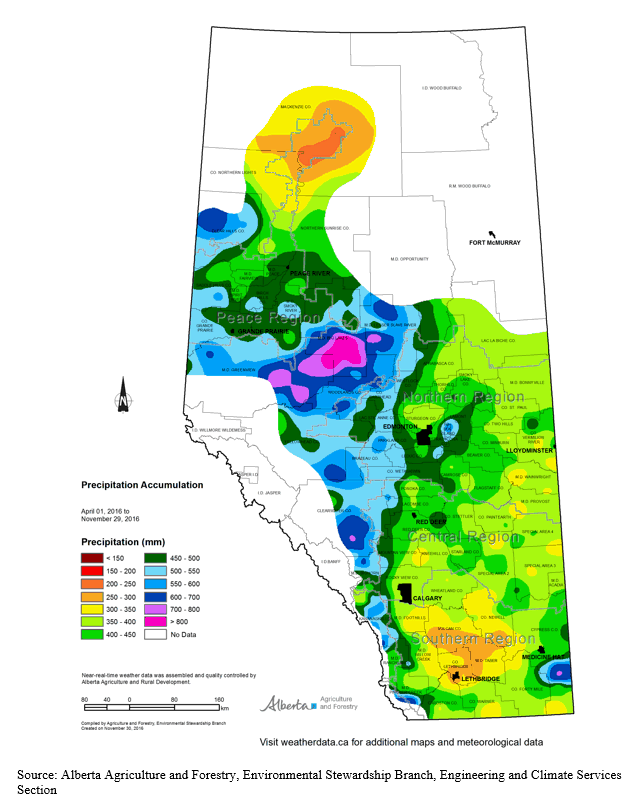
This report presents a review of the crop season in Alberta and an analysis of crop production statistics for 2016. In addition, a precipitation map for the 2016 crop season is attached for reference.
The 2016 Crop Season
Although the 2016 crop season in Alberta started with a dry spring, crop growing conditions were mainly favourable for producers. Precipitation early in the season was appropriate and timely to produce above average yields. However, persistent wet and cold weather conditions from mid-August to November delayed the harvest season which was one of the longest on record. The excessive soil moisture affected crop quality.
A warm dry winter resulted in little snow cover to seal the soil and provide moisture for crops. A quick snow melt in spring also provided the opportunity for an early start to seeding. Fall seeded crops emerged from the winter with 80 per cent rated as good to excellent, 16 per cent fair and only four per cent poor. Surface soil moisture condition at the beginning of May was reported as 11 per cent poor, 45 per cent fair, 33 per cent good and 11 per cent excellent. By the end of May, seeding was practically completed across the province, one week ahead of the 5-year average. Also, precipitation in the last two weeks of May provided timely improving soil moisture for both surface and sub-surface ratings. Surface soil moisture as of May 31 was reported as two per cent poor, 15 per cent fair, 39 per cent good, 37 per cent excellent and seven per cent excessive. Poor to fair pasture conditions remained dominant in May, but changed to eight per cent poor, 38 per cent fair, 41 per cent good and 13 per cent excellent as of May 31, which then remained generally good to excellent for the rest of the season.
Warmer weather in June was beneficial to crops and forages across the province and enhanced crop emergence to 91 per cent emerged in the first week of June. During June, crops and forages throughout the province continued to benefit from warmer temperatures, while periodic rainfall led to excessive soil moisture in some parts. Precipitation was highly variable across the province in June, from near excessive amounts of 150 to 250 per cent of normal in the Peace Region, to above average quantities of 100 to 200 per cent in North West, to below average of 50 to 100 per cent in the North East, and dry conditions to the Central and South Regions at 35 to 50 per cent of normal. Crop conditions as of June 28 was rated as 79 per cent good to excellent, compared to 30% in the same week in 2015, and the 5-year average (2011-2015) of 73 per cent.
In July, warmer temperatures prevailed across the province but persistent showery weather continued in most regions, affecting crop conditions particularly in the Central and North East Regions. Provincially, crop condition ratings were reported as four per cent poor, 14 per cent fair, 58 per cent good and 24 per cent excellent as of July 26, which was above the 5-year average. The initial yield estimate by the end of July indicated that the provincial yield index was up 9.2 index points from the 5-year average due to the above average crop growing conditions. On the other hand, haying progress was affected negatively by precipitation. By the end of July, only 65 per cent of first cut hay was baled (compared with the 5-year average of 70 per cent). The quality of baled hay was also poor with 59 per cent good to excellent quality, compared with the 5-year average of 70 per cent. Also, the surface soil moisture was higher than the 5-year average. As of July 26, the surface soil moisture (5-year averages in brackets) was rated as three (seven) per cent poor, 10 (20) per cent fair, 44 (46) per cent good, 41 (24) per cent excellent and two (three) per cent excessive.
Persisted wet weather continued to affect the province during the month of August. As a result of the unsettled weather conditions, harvest progress was minimal. Harvest of winter cereals, dry peas and barley began in the first week of August, with a very little progress during the rest of the month. The preliminary estimates of yield improved with provincial yield index up 11.1 index points from the 5-year average, as of August 23. Surface and sub-surface soil moisture by the end of August reflected the effects of the continuing precipitation. Surface soil moisture was reported as two per cent poor, 10 per cent fair, 51 per cent good, 34 per cent excellent and three per cent excessive. As well, the wet conditions influenced pasture conditions negatively and deteriorated the quality of second cut hay.
Harvest challenges continued into September, due to wet weather conditions. Producers were able to make some progress in the last two weeks of the month as warm dry weather covered much of the province. Even so, wet conditions continued to hinder harvest progress necessitating the need to bypass some acres, with the hope of returning later once these areas had dried up. As of September 27, provincial harvest progress stood at 50 per cent combined that was marginally behind 2015, but remained about 20 per cent behind the 5-year average of 69 per cent. By the end of September, harvest was behind in all regions and 26 per cent provincially, compared to 2015. Interestingly, September rainfall was beneficial for fall seeded crops with crops ratings reported as one per cent poor, 13 per cent fair, 58 per cent good and 28 per cent excellent.
Compared to the long term normal (since 1960), most areas in Alberta experienced more snow in October than is typical. Harvest came to a halt due to snow flattening crops and covering swath. Nevertheless, producers took full advantage of a few days with good weather in between to push the provincial harvest percentage up to 76 per cent by the first of November, compared to 95 per cent completed last year. The delayed harvest saw an emergence of crop quality issues. By the first of November, the preliminary dryland yield index for the province declined slightly, but remained 13.5 per cent above the 5-year average. Excessive soil moisture conditions continued to get progressively worse, especially for North West Region (where the surface soil moisture was rated as 59 per cent excellent and 41 per cent excessive) and Peace Region (where the surface soil moisture rated as 17 per cent fair, 40 per cent good, 19 per cent excellent and 24 per cent excessive). Benefiting from all of this were fall seeded crops which continued to perform well, with over 86 per cent of the crops rated in good or excellent.
A combination of snow, cool and wet weather conditions in the month of November made the harvest season for 2016 one of the longest on record. Some producers began their harvest operations in the first week of August and were unable to complete it until the end of November. By the end of November, there were still some crops left in the field, especially in the Northern Regions. Provincially, 10 per cent of crops remained unharvested as of November 29, 2016. Unharvested crops for the North East, North West and Peace Regions were estimated more than 15 per cent. Despite the harvest challenges for crops across the province, the dryland yield index was still 14.1 per cent above the 5-year averages. This resulted in an above average crop production year. Based on Statistics Canada, estimates of crop production in 2016 was the second highest on record after 2013. However, crop quality for cereals were below their 5-year averages, with the exception of malt barley which was higher. Compared to the 10-year averages, 2016 saw a drop in the top two grades for most crops. The decline was largely attributed to less crops being qualified as number 1 quality. Crop quality for canola number one and the top two grades of dry peas were in line with the 5-year averages.
Insects and Crop Diseases
Major issues in 2016 were cutworms mostly in canola and to a lesser extent in other crops as well. Pea leaf weevil was a big concern for producers in Central and Southern Alberta. Flea beetles were also once again an issue but not as big as problem as the previous year. Aphids in lentils were at very high levels very early in Southern Alberta.
Pasture and Forage
The season started with poor conditions for pasture. As of May 3, conditions were reported as 30 per cent poor, 34 per cent fair, 32 per cent good and four per cent excellent. The poor to fair situation remained dominant in May, but changed to eight per cent poor, 38 per cent fair, 41 per cent good and 13 per cent excellent as of May 31. After this, pasture conditions remained generally good to excellent for the rest of the season. As of August 23, pasture conditions were reported as three per cent poor, 18 per cent fair, 61 per cent good and 18 per cent excellent. However, too much precipitation and excessive soil moisture from the end of August caused pasture conditions to deteriorate somewhat. In some areas by October 25, conditions were reported as nine per cent poor, 25 per cent fair, 56 per cent good and ten per cent excellent.
By mid-August, first cut dryland hay was 85 per cent complete, with an average provincial yield of 1.6 ton per acre. For irrigated hay, the percentage was higher with 98 per cent complete and a yield of 2.1 tons per acre. The quality of first cut hay was rated as 55 and 56 per cent good to excellent, respectively, for dryland and irrigated hay. As of September 20, the average yield for second cut hay was 1.2 tons per acre for dryland, and 1.5 tons per acre for irrigated. Some producers even had a third cut of irrigated hay, with yield at 1.0 ton per acre.
Based on Statistics Canada November estimates, tame hay production stood at 7.5 million tonnes, up 57.3 per cent from 2015, and 4.7 per cent above the 10-year average (2006-2015). Driving most of this gain was a significant increase in yield. The average yield of tame hay increased 53.8 per cent to 2.0 tonnes per acre, while harvested area was up 4.0 per cent, to 4.4 million acres.
Alberta Crop Production, 2016
Total 2016 Crop Production
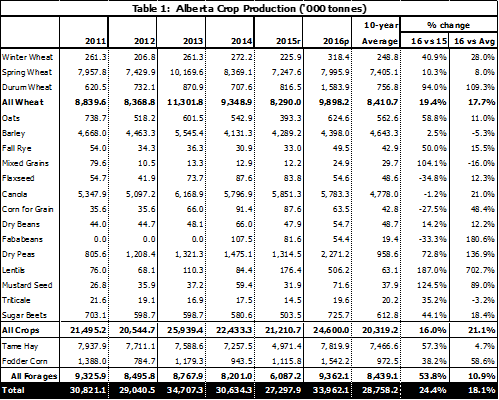
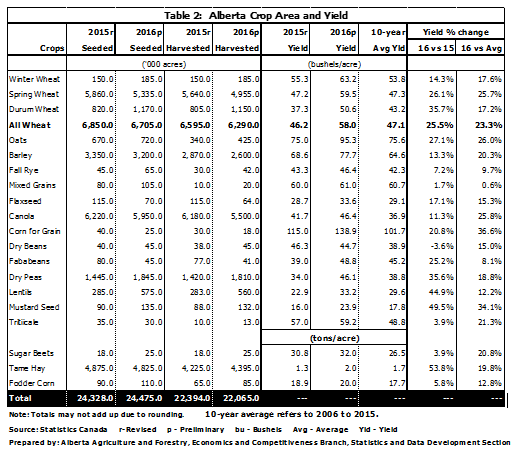
On December 6, 2016, Statistics Canada released its final 2016 estimates of crop production for Canada and provinces. Production of selected field crops (including forages) in Alberta totalled 34.0 million tonnes, up 24.4 per cent from a year ago. Excluding forages, production totalled 24.6 million tonnes, up 16.0 per cent from 2015 (see Table 1). In either case, this is the highest production on record after 2013. Although producers were challenged with a wet and cold harvest season, crop production in 2016 was 21.1 per cent higher than the 10-year average (2006-2015), while forage production was up 10.9 per cent, resulting in an overall increase of 18.1 per cent in total production. As well, the provincial average yields were higher than in 2015 and the 10-year average (see Table 2). However, the wet, cold weather and a long harvest season impacted crop quality which was generally below average. While the total seeded area of principal field crops increased 0.6 per cent, harvested area declined 1.5 per cent.
2016 Production by Crop Type
In 2016, total production of spring wheat increased 10.3 per cent, to 8.0 million tonnes. The higher production stemmed from an increase in average yield (up 26.1 per cent) compensating for a decline in harvested area (down 12.1 per cent). The provincial average yield was 59.5 bushels per acre, with harvested area at 5.0 million acres. Durum wheat production increased 94.0 per cent, to a record of 1.6 million tonnes, due to a 42.9 per cent increase in harvested area to 1.2 million acres. The average yield was up 35.7 per cent from 2015, to 50.6 bushels per acre. Overall, production of all wheat was 9.9 million tonnes, an increase of 19.4 per cent from 2015.
Total barley production increased 2.5 per cent from 2015 to 4.4 million tonnes. The average yield increased 13.3 per cent to 77.7 bushels per acre, while harvested area was down 9.4 per cent to 2.6 million acres.
Total canola production dropped 1.2 per cent to 5.8 million tonnes. This was attributed to a lower harvested area of 5.5 million acres (down 11.0 per cent from 2015), despite average yield increasing 11.3 per cent, to 46.4 bushel per acre, a new record high.
In 2016, dry peas production jumped 72.8 per cent to a record 2.3 million tonnes, due to a higher yield of 46.1 bushel per acre (up 35.6 per cent from 2015) and harvested area (up 27.5 per cent).
Total oats production increased by 58.8 per cent, to 624,600 tonnes, due to an increase in both yield and harvested area. Harvested area was up 25.0 per cent to 425,000 acres, while average yield rose 27.1 per cent to 95.3 bushels per acre.
Lentils production reached a new high of 506,200 tonnes (up 187.0 per cent from 2015), as a result of a 97.9 per cent increase in harvested area and a 44.9 per cent increase in the average yield, to 1,993 pounds per acre.
In 2016, forage production increased 53.8 per cent to 9.4 million tonnes and was attributed to higher production of both fodder corn and tame hay. Fodder corn production increased 38.2 per cent to 1.5 million tonnes, while tame hay production increased 57.3 per cent to 7.8 million tonnes.
2016 Crop Production, Canada
In 2016, total Canadian production was 20.5 million tonnes for spring wheat, 7.8 million tonnes for durum, 8.8 million tonnes for barley, 3.1 million tonnes for oats, 18.4 million tonnes for canola, and 4.8 million tonnes for dry peas.
Alberta Forage Production, 2016
Based on the Statistics Canada report “Production of Principal Field Crops, December, 2016”, forage production (fodder corn and tame hay) for Alberta in 2016 rose 53.8 per cent from a year ahead, to 9.4 million tonnes. The marked increase was attributed to higher production for fodder corn and tame hay. Fodder corn production jumped 38.2 per cent to 1.5 million tonnes driven by an increase in both harvested area and yield. For tame hay, production was estimated at 7.5 million tonnes, up 57.3 per cent from 2015, and 4.7 per cent above the 10-year average (2006-2015). Driving most of the gain was a significant increase in yield. The average yield of tame hay was up 53.8 per cent to 2.0 tonnes per acre, while harvested area rose 4.0 per cent, to 4.4 million acres.
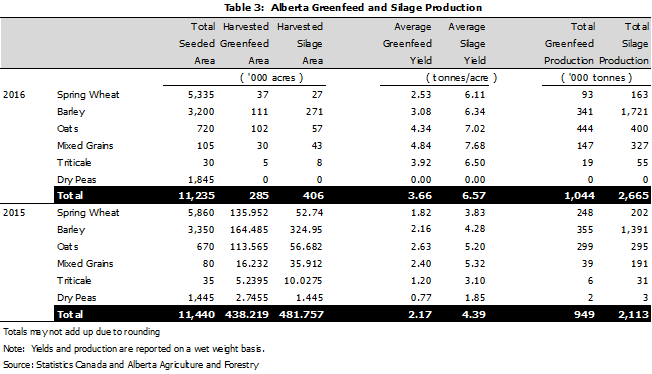
Based on a survey conducted by the Statistics and Data Development Section of Alberta Agriculture and Rural Development, total greenfeed production in the province increased 10.0 per cent from 2015, to 1.044 million tonnes (Table 3), mainly due to a 69.0 per cent increase in average provincial yield to 3.7 tonnes per acre and despite harvested area falling 34.9 per cent. Total silage production was estimated at 2.7 million tonnes, up 26.2 per cent from 2015. Driving the gain was 49.7 per cent increase in the average provincial yield to 6.57 tonnes per acre, which more than offset the 15.7 per cent decline in harvested area.
Total area harvested for greenfeed and silage declined 24.9 per cent in 2016 to 691,171 acres (See Figure 1). Greenfeed harvested area fell 34.9 per cent to 285,227 acres, while silage acreage declined by 15.7 per cent to 405,954 acres. Compared to 2015, producers harvested less greenfeed and silage mainly because of the significant increase in hay production and grazing their swaths, due to the long, cold and wet harvest season. Just to caution, data for the 2016 survey was collected in Mid-October, when farmers still did not have a very good idea about the harvest season, and as such, there could be a revision in the acreages.
Contacts
For additional information relating to this report, please do not hesitate to contact the author.
This report is also available on the Internet at:
http://www1.agric.gov.ab.ca/$department/deptdocs.nsf/all/sdd4191
Alberta Agriculture and Rural Development
Economics and Competitiveness Division
Statistics and Data Development Branch
Ashan Shooshtarian
Crop Statistician
780-422-2887
Email: ashan.shooshtarian@gov.ab.ca
Alberta Crop Production Tables
Precipitation Map for the 2016 Crop Season
 |
|