| | These figures indicate the total number of livestock inspected during the month of March 2010. Inspections are conducted by the Livestock Identification Services (LIS) under the authority of the Livestock Identification and Commerce Act.
Summary
.
 | March |  Fiscal Y.T.D. Fiscal Y.T.D. | Year-to-Date |
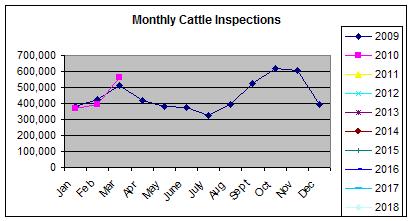
| Cattle inspected | 562,202 | 5,364,805 | 1,328,591 |
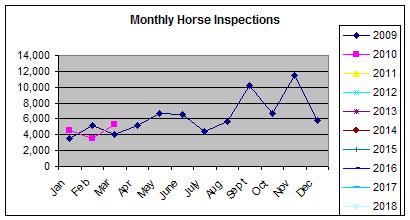
| Horses inspected | 5,357 | 76,272 | 771,746 |
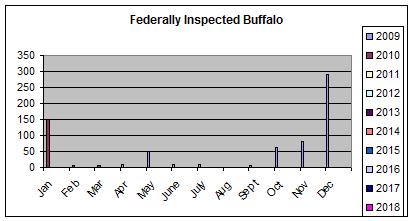
| Buffalo Inspected | 22 | 698 | 766,411 |
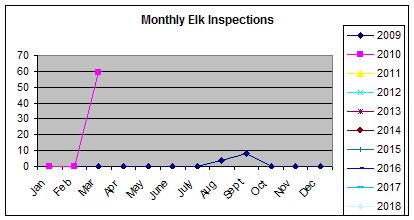
| Elk inspected | 59 | 71 | 766,448 |
| Deer inspected | - | - | - |
| 2010 | 567,640 | 5,441,846 | 1,334,029 |
| 2009 | 514,587 | 5,564,645 | 1,333,857 |
| Change |
| Increase/Decrease | 53,053 | (122,799) | 172 |
| Percentage | 10.31% | -2.21% | 0.01% |
| .
 | March |  Fiscal Y.T.D. Fiscal Y.T.D. | Year-to-Date |
| Market inspection | 204,528 | 1,876,913 | 970,917 |
| No Charge inspection | 53,596 | 564,642 | 53,595 |
| Packing Plants | 155,260 | 1,762,122 | 155,260 |
| Out-of-Province | 57,202 | 394,038 | 57,202 |
| Miscellaneous | 40,018 | 376,671 | 40,018 |
| Feedlot | 54,153 | 430,246 | 54,153 |
| Abattoirs | 2,771 | 35,953 | 2,771 |
| Mobile Butchers | 54 | 416 | 54 |
| Elk | 59 | 71 | 59 |
| Deer | - | - | - |
| Random inspections | 0 | 0 | 0 |
| US Imports | 0 | 774 | 0 |
| Restricted Feeder inspection | 0 | 0 | 0 |
| Total | 567,640 | 5,441,846 | 1,334,029 |
|
Total Livestock Leaving Alberta
.
| Destination | March | Fiscal Y.T.D | Year-to-date |
| British Columbia | 4,188 | 45,493 | 10,245 |
| Saskatchewan | 6,723 | 86,221 | 16,912 |
| Manitoba | 420 | 14,209 | 3,028 |
| Ontario | 4,722 | 46,477 | 13,707 |
| Quebec | 538 | 6,625 | 1,063 |
| USA | 60,226 | 389,759 | 143,988 |
| Maritimes | 1 | 13 | 4 |
| Argentina | 0 | 0 | 0 |
| Northwest Territories | 0 | 0 | 0 |
| Yukon | 0 | 0 | 0 |
| Other | 283 | 2,250 | 815 |
| Total | 77,101 | 591,037 | 189,762 |
.0 | .
| Kinds | March | Fiscal Y.T.D. | Year-to-date |
| Steers | 31,163 | 226,167 | 81,199 |
| Heifers | 32,472 | 205,516 | 69,768 |
| Calves | 284 | 25,668 | 1,551 |
| Cows | 3,279 | 71,692 | 17,903 |
| Bulls | 1,639 | 20,834 | 3,702 |
| Yearlings | 7,866 | 36,915 | 14,580 |
| Horses | 398 | 4,225 | 1,059 |
| Buffalo | 0 | 0 | 0 |
| Elk | 0 | 0 | 0 |
| Miscellaneous | 0 | 0 | 0 |
| Total | 77,101 | 591,037 | 189,762 |
|
Cattle Inspections
Inspection summary
 | March | Fiscal Y.T.D. | Year-to-date |
| Cattle slaughtered in Alberta direct | 150,903 | 1,804,993 | 150,903 |
| Cattle slaughtered in Alberta indirect | 31,061 | 367,928 | 31,061 |
Number Slaughtered - Subtotal | 181,964 | 2,172,921 | 181,964 |
| Number of livestock exported | 76,703 | 586,812 | 76,703 |
| Number of feeder and replacement cattle | 303,535 | 2,605,072 | 303,535 |
Total Cattle | 562,202 | 5,364,805 | 562,202 |
Destination of cattle shipped out of Alberta
Destination | Feeder | Slaughter | Replacement | Total |
March | YTD | March | YTD | March | YTD | March | YTD |
| British Columbia | 2,262 | 3,413 | 1,625 | 2,942 | 244 | 366 | 4,131 | 42,839 |
| Manitoba | 168 | 292 | 223 | 1,276 | 17 | 18 | 408 | 13,394 |
| Saskatchewan | 4,133 | 5,767 | 926 | 2,773 | 1,593 | 2,357 | 6,652 | 84,024 |
| Ontario | 4,693 | 8,003 | - | 902 | 11 | 86 | 4,704 | 46,255 |
| USA | 8,393 | 12,425 | 51,657 | 100,457 | 54 | 59 | 60,104 | 388,770 |
| Maritimes | - | - | - | - | 1 | 2 | 1 | 11 |
| Quebec | 523 | 637 | - | 36 | 1 | 1 | 524 | 6,506 |
| Other | - | - | - | - | - | - | - | 95 |
| Totals | 20,172 | 30,537 | 54,431 | 108,386 | 1,921 | 2,889 | 76,524 | 581,894 |
Horse Inspections
| March | Fiscal Y.T.D. | Year-to-date |
| Horses slaughtered in Alberta direct | 1,913 | 23,456 | 1,913 |
| Number exported | 398 | 4,225 | 398 |
| Number of horses traded | 3,046 | 48,591 | 3,046 |
| Total horses | 5,357 | 76,272 | 5,357 |
Buffalo Inspections
| Buffalo | March | Fiscal Y.T.D. | Y.T.D. |
| Federal | 5 | 678 | 5 |
| Provincial | 17 | 20 | 17 |
| Total | 22 | 698 | 22 |
Charts
 |
|