| | Background | Irrigation management | Checking soil water | Conclusion
Irrigation in Alberta has grown significantly in the last decade. Historically, it has increased from an irrigated area of approximately 182,000 ha in 1950 to more than 600,000 ha in 2011.
Background
Earlier irrigation development was restricted to relatively level land, so surface irrigation methods could be used. As a result, the distribution of irrigation water, both to the farm and onto the land surface, relied on gravity. The introduction of sprinkler irrigation in the early 1950s eliminated the necessity of having near-level land before producers could consider irrigation development.
On-farm irrigation application efficiencies have improved as well from often less than 30 per cent efficiency with some surface irrigation methods to greater than 70 per cent efficiency with sprinkler irrigation. With the newer, low pressure sprinklers positioned just above or within the crop canopy, application efficiencies have now improved to about 80 per cent.
Irrigation Management
The management of the irrigation system as well as the entire philosophy about irrigation sufficiency have changed with changes in irrigation methods.
Surface irrigation
The first irrigation application using surface irrigation methods was typically applied just after spraying for the first flush of weeds in early to mid-June. The application amount was enough so the water would travel from the top of the field to the bottom using border dykes or contour ditches.
Application amounts depended on the length of the field and the width of the borders or contours, but typically were at least 150 mm, and often greater than 200 mm. A second surface application, if needed, was typically applied in mid to late-July using the same volume of irrigation water.
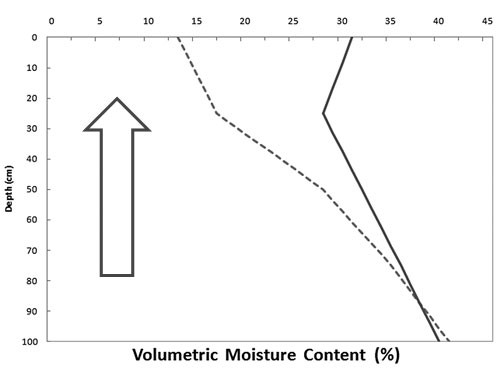
The approach to irrigation management using surface irrigation systems was to “fill up” (to field capacity or above) the entire soil profile each time an irrigation was applied, often in excess of what the soil could retain, and to rely on the stored soil water to supply the crop for an extended interval between irrigation applications(Figure 1).
Wheel-move irrigation
The approach to irrigation management did not change with the conversion from surface to wheel-move irrigation. The wheel-move irrigation system was designed and sprinklers sized to apply approximately 13 mm (0.5 inches) per hour. The typical operation of a wheel-move system was to leave it in one spot for 8 or 12 hours to apply 100 or 150 mm of irrigation water, respectively.
This irrigation management approach was similar to surface irrigation: that was to “fill up” the soil root zone each time an irrigation was applied and to rely on the retained water in the soil rooting zone to supply the crop for extended periods.
Both surface and wheel-move irrigation managed soil water from the bottom up, interpreted as an expectation that there would always be retained soil water at the lower depths in the soil root zone to sustain the crop through extended intervals when no irrigation water was applied (Figure 1).

Figure 1. Typical soil water profile for surface and wheel-move irrigation methods prior to (dashed line) and after (solid line) an irrigation application.
Centre pivot irrigation
With centre pivot irrigation, having a soil profile at field capacity or “full” is more the exception than the normal irrigation application goal. Centre pivot systems are not designed to put on a large amount of irrigation water at one time; rather, a 2-day circle with a 400 m centre pivot system with capacity of 60 Ls-1 (¼ mile length, 950 US gpm capacity) typically applies 15 to 20 mm.
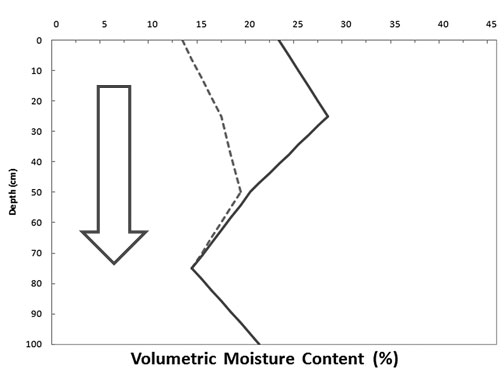
The irrigation decisions are always based on how a crop uses soil water (transpiration) on a daily basis, and the management of the irrigation system is for a fairly shallow rooting depth (50 cm or less, 50 per cent of the root zone depth) (Figure 2). The irrigation philosophy is not to “fill up” the plant root zone, but to replace water the plant has used during a specified interval (e.g. weekly).

Figure 2. Typical soil water profile for centre pivot irrigation prior to (dashed line) and after (solid line) an irrigation application.
If the system is not adequate to meet peak water use requirements, it may be necessary or desirable to build up soil water reserves during off-peak times for plant roots to access stored soil water during peak evapotranspiration. Other considerations for increasing stored soil water would be to supply the crop with soil water in case of equipment failure (pump or pivot) or as a disease minimization strategy.
An important consideration for center pivot irrigation is to schedule irrigation based on the upper 50 to 60 cm of the root zone. Most crops obtain 70 to 80 per cent of their water needs from the upper 50 per cent of the rooting depth, so irrigation scheduling should not be based on the level of soil water in the lower root zone depths.
Stored soil water in the lower root zone depths will sustain a plant if necessary, but potential yields will never be realized if the upper 50 per cent of the plant root zone is consistently kept at or below 50 per cent of available.
Irrigation scheduling for centre pivot irrigation requires frequent applications that match the soil water extraction pattern of the crop grown. The best a properly designed centre pivot system is able to do is to “keep up” with soil water extraction by the crop (evapotranspiration) during times of peak demand.
Realizing that at peak water use, the 15 to 20 mm applied by the irrigation system in 2 days could be transpired by the crop within 3 days, timely information about the soil water status is essential to ensure the crop is not stressed during critical growth and maturity stages.
Checking Soil Water
Many tools are available for assisting irrigation managers in ensuring soil water is always optimal for crop use. Many irrigators use a manual soil sampler, either a step-on Oakfield soil sampler or a crank-type Dutch auger. Water in the physical sample obtained is determined based on the “feel” of the soil (Table 1).
Table 1. Determination of soil moisture using the hand-feel method
 | Soil Texture Classification |
Moisture deficiency (mm) | (Loamy sand) | (Sandy loam) | (Loam) | (Clay loam) |
0 | Leaves a wet outline on hand when squeezed | Leaves a wet outline on hand when squeezed; makes a short ribbon* | Leaves a wet outline on hand when squeezed; will ribbon out about 25 mm | Leaves a wet outline on hand when squeezed; will ribbon out about 50 mm |
5 | Appears moist | Makes a hard ball |  |  |
10 |  |  |  |  |
 | Makes a weak ball* | Forms a plastic ball; slicks when rubbed | Will slick and ribbon easily |  |
15 | Sticks together slightly | Makes a good ball |  | Makes a thick ribbon; slicks when rubbed |
20 | Very dry, loose, flows through fingers | Makes a weak ball | Forms a hard ball | Makes a good ball |
25 | Wilting point | Sticks together slightly | Forms a good ball | Will ball but will not flatten, rather crumble |
31 |  | Forms a weak ball |  |  |
36 | Wilting point |  | Clods crumble |  |
46 |  |  | Wilting point |  |
51 |  | Wilting point |  |  |
*Note: A “ball” is formed by squeezing a handful of soil firmly. A “ribbon” is formed by squeezing soil between thumb and forefinger.Adapted from: Cooperative Extension, College of Agriculture & Life Sciences, University of Arizona, (2006).
Probes that measure soil water are widely available in various configurations and methods of measurement. The most widely available for irrigation scheduling are probes that measure the dielectric constant or apparent relative permittivity of the soil and relate that to profile soil water.
The properties of soil that allow this technology to be adopted are as follows: the dielectric constant (dimensionless value) of the mineral component of the soil is reasonably constant at around 4, for air is negligible at 1, and for water, 81. Thus, if the dielectric constant of a soil volume changes, that change is a consequence of an increase or decrease in soil water content.
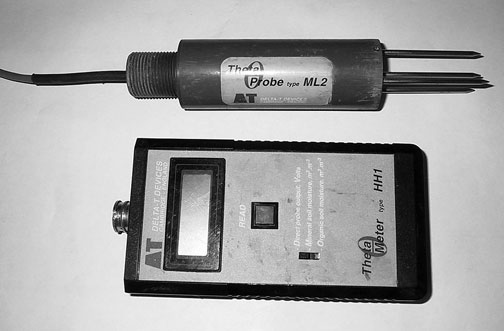
Some common trade names for soil water probes that use the soil’s dielectric constant include CS620 Hydrosense from Campbell Scientific, EnviroSCAN and Diviner from Sentek, TRIME from Imko, and the Theta Probe(Figure 3), and PR2-6 from Delta-T technologies.

Figure 3. Theta probe by Delta-T technologies.
The second most common type of probe for determining soil water is the type that measures the negative pressure of the soil (tension) and relates that to soil water. Soil tension is the force that holds water within the soil. It is also referred to as negative potential, negative pressure, soil matrix forces and/or soil suction.
Soil at saturation, meaning all the soil pores are filled with water, has a tension near zero. As the water is extracted from the soil (soil drying), the pressure in the soil becomes more negative. As the pressure in the soil becomes more negative, less water is available for extraction from the soil by the plant during the transpiration process.
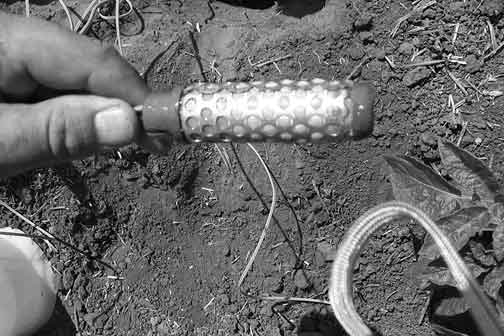
Common trade names for probes that measure the negative pressure of the soil are Watermark by Irrometer (Figure 4), Equitensiometer by Delta-T, T4 field tensiometer by Decagon, and standard gypsum blocks from Delmhorst.

Figure 4. Watermark sensor by Irrometer.
Computer models that estimate the rate at which the crop is transpiring soil water are becoming commonplace in irrigation scheduling. These models are based on easily measured meteorological parameters that influence evapotranspiration (temperature, wind speed, incoming solar radiation, and relative humidity) and co-efficients that vary depending on the crop grown.
Crop evapotranspiration can be assessed on a daily basis with the use of these computer models, and with this information, timely irrigation scheduling can be initiated (Figure 5).
Many factors influence the way a crop transpires stored soil water (fertility, disease, weed pressure, root development, level of soil water in the profile, etc.). Using these computer models for scheduling irrigation does not preclude the need for occasional manual checking of soil water in the field, but these decision-support tools allow the irrigator to extend the intervals between manual checking from weekly or more frequently to every two or three weeks.
The Irrigation and Farm Water Division of Alberta Agriculture and Rural Development has developed two computer-based irrigation management tools for use in irrigation scheduling. The first one is the Alberta Irrigation Management Model (AIMM) with output shown in Figure 5.
The AIMM model is a desktop, computer model with input requirements specific to the individual field or section of the field. The second is the Irrigation Management Crop Information Network (IMCIN), which is a web-based irrigation decision-support tool that estimates daily crop evapotranspiration. Both these irrigation management decision-support tools are available from Alberta Agriculture’s website at: http://www.agric.gov.ab.ca/acis/imcin/about.jsp
Conclusion
The introduction and widespread adoption of centre pivot irrigation has been instrumental in the expansion of the irrigated crop production area in southern Alberta. Consistency of yield and quality of product are the consequences of a properly managed centre pivot irrigation system.
Proper irrigation management, when using a centre pivot irrigation system, focuses on replacing the soil water transpired by the crop within the upper 50 cm or 50 per cent of the root zone depth. Thus, frequent determination and replacement of transpired soil water are necessary to avoid crop stress and reduction in yield and quality.
Many tools (soil water monitoring instruments, decision-support software and pivot management software) are available to the irrigator to assist with timely irrigation scheduling. Irrigators are advised to use the tool or tools that fit best with their irrigation and production operation.
Disclaimer
The depiction of certain brands or products in the images in this factsheet does not constitute an endorsement of any brand or manufacturer. The images were chosen to illustrate certain aspects of irrigation practices only, and the author does not wish to suggest that the brands or products shown are in any way superior to others. Producers should note the many products on the market and research them carefully before purchasing.
Prepared by
Ted Harms
Alberta Agriculture and Rural Development
For more information, contact
Alberta Ag-Info Centre
Call toll free: 310-3276 (FARM)
Source: Agdex 560-2. May 2011. |
|