| | The 2007 Crop season | Insects and crop diseases | Forage and pasture | Alberta crop production, 2007 | Alberta crop production tables | Precipitation Map
This report presents a review of the 2007 crop season and an analysis of 2007 crop production statistics, as well as information on feed availability in Alberta. In addition, a precipitation map for the 2007 crop season is attached for reference.
The 2007 Crop Season
Wet weather conditions in spring caused major delays in field operations. In most areas of the province, seeding progress was well behind normal. As a result, many producers switched to shorter season varieties of canola or cereals for feed and forage production. This was the case particularly in the Peace Region, North West Region and western parts of the Central Region. Some fields were saturated and were left unseeded, resulting in a higher summerfallow area than intended.
Despite the late start, nearly 80 percent of spring seeded crops and 90 percent of winter cereals were in good to excellent condition in late June, based on information from the Alberta Crop Report. However, in some areas, heavy rainfall in June caused localized flooding and left water standing in low-lying fields.
The persistent hot, dry weather across the province in July depleted soil moisture reserves and caused crops to abort flowering and podding, resulting in significant deterioration in crop conditions and yield potentials. The hot, dry weather also hastened crop development, particularly in the Southern Region.
The early maturity of crops allowed producers to start harvesting operations earlier than usual in the province. By mid-August, about seven percent of the crop was already in the bin, with the majority of crop harvest occurring in the Southern Region. However, due to late seeding, the development of some crops was still behind normal. Additionally, hailstorms caused crop damage in many areas of the province in August.
Cool, damp weather conditions prevailed through the second half of August and most of September. These conditions slowed crop maturity and hampered harvesting operations. Based on information from the Alberta Crop Report, harvest was only 65 percent complete as of September 27, compared to 85 percent complete in an average year.
In October, producers took advantage of drier weather conditions and made significant progress in their harvesting operations. By the end of October, combining in the province was virtually complete, although some crops, mostly canola in the Peace Region, were taken off the field in November. In some cases, crops intended for grain production were either grazed or baled for forage use. Also, some crops were left in the field over the winter, due to excessive moisture conditions.
Overall, the cool, damp fall weather not only caused major delays in harvest operations, but also resulted in a significant deterioration in crop quality. Provincially, yields for most major crops were similar to their 10-year averages, but lower than in 2006. With respect to crop quality, estimated grades were average for cereals, but below average for canola.
Insects and Crop Diseases
In 2007, grasshoppers, gophers and sawflies caused the most noticeable crop damage. Also reported were concerns and problems with other pests, including cabbage seedpod weevil, diamondback moths, wheat midge, root maggots, wireworm, lygus bugs, and bertha armyworm moths.
Crop diseases were less prevalent in 2007 than in most years, although the application of fungicides was reported in some areas. The lower incidence of diseases was attributed to the dry weather conditions in July and early August.
Forage and Pasture
Due to excellent soil moisture reserves, pasture and tame hay growth ranged from good to excellent in most areas of the province during the spring of 2007. According to the Alberta Crop Report released in late May, pasture conditions were five percent poor, ten percent fair, 56 percent good, and 29 percent excellent, with similar ratings reported for tame hay as well. Pasture and tame hay continued to improve in June, as soil moisture conditions remained favourable.
High temperatures and a lack of rainfall during July and early August slowed pasture and tame hay growth. The Alberta Crop Report released in mid-August rated pasture conditions as 26 percent poor, 37 percent fair, 33 percent good, and four percent excellent, a substantial decline from conditions in the spring.
With respect to tame hay, the provincial average yield in 2007 was the highest in the last decade, due mainly to well above average yields from the first cut. Overall, hay quality ranged mostly from fair to excellent. Also, it is worth mentioning that to secure additional forage supplies, some producers chose to harvest some of their annual cereals as greenfeed and silage.
Alberta Crop Production, 2007
On December 6, 2007, Statistics Canada released a report entitled “November Estimate of Production of Principal Field Crops, Canada, 2007”. It showed Alberta’s total production of principal crops in 2007 at 26.4 million tonnes, or two percent lower than in 2006, but 14 percent higher than the 10-year average (see Table 1). Due to the hot, dry July weather, provincial average yields for most crops were lower than in 2006, but similar to their 10-year averages (see Table 2). In addition, the total seeded area and harvested acreage for principal crops in the province remained virtually unchanged from a year ago, while total summerfallow area contracted by five percent to 2.1 million acres, from 2.2 million acres in 2006.
Regarding estimates for specific crops, total 2007 production of spring wheat declined 22 percent from a year earlier, to 5.2 million tonnes. The lower production can be attributed to a combination of a smaller harvested area and reduced yield. Total harvested area was estimated at 4.8 million acres, or 16 percent lower than a year earlier. The provincial average yield was 40.2 bushels per acre, down seven percent from 2006. For durum wheat, production increased to 670,000 tonnes, or two percent higher than in 2006. The higher production stemmed from a large increase in harvested area, which more than offset a decline in yield. The provincial average yield was estimated at 32.4 bushels per acre, or 24 percent lower than in 2006. The significantly lower yield was the result of severe dry conditions during the 2007 summer in the Southern Region, where most of the crop was grown. Overall, production of all wheat was estimated at 6.1 million tonnes, down 19 percent from 2006.
Oats production was estimated at 627,400 tonnes in 2007, or 11 percent lower than in 2006. The decline in production was attributed to a reduction in the harvested area, as yield was practically unchanged. The provincial average yield was 65.6 bushels per acre, compared to 65.0 bushels per acre in 2006, and the 10-year average of 67.3 bushels per acre. For barley, production increased 16 percent from 2006, to 5.1 million tonnes in 2007. The gain was the result of a 26 percent increase in harvested area. The provincial average yield was estimated at 55.0 bushels per acre, down eight percent from 2006. Despite the higher barley production, supplies of feed grains in the local market remained tight due to a low carry-over from the 2006/07 crop year, and the increased use of grains for ethanol production. As a result, significant amounts of US corn were imported into the province to address the supply shortage.
Canola production in 2007 declined to 3.0 million tonnes, or 13 percent lower than in 2006. Driving the decline was a reduction in the provincial average yield, as harvested area remained virtually unchanged. The provincial average yield was estimated at 29.6 bushels per acre, down 12 percent from 2006. Despite an increase in harvested area, dry peas production in 2007 fell five percent to 527,500 tonnes. Driving the lower production was a reduction in yield, which fell nine percent to 32.6 bushels per acre.
Alberta greenfeed and silage production, 2007
As a result of the near record tame hay production in 2007, the need for greenfeed and silage production was significantly reduced. Results from a survey conducted by the Statistics and Data Development Unit of Alberta Agriculture and Rural Development pegged the total provincial greenfeed production in 2007 at 1.1 million tonnes, or 32 percent lower than in 2006. Likewise, silage production in 2007 fell 34 percent, to 3.1 million tonnes. The marked production declines for both greenfeed and silage were mainly due to substantial reductions in the area harvested. Total area harvested for greenfeed declined 28 percent from 2006, to 430,000 acres, while silage acreage fell 31 percent to 550,000 acres. The estimated provincial average yields for greenfeed and silage were slightly down from 2006, due to a combination of delayed seeding and the hot, dry weather in July. In 2007, barley, oats and mixed grains remained the major crops harvested for greenfeed and silage production.
Feed availability and quality in Alberta
Most livestock producers in Alberta managed to secure their supplies of feed grains for the 2007/08 crop year despite tight supplies and high prices, based on results of a survey conducted by the Statistics and Data Development Unit of Alberta Agriculture and Rural Development in November 2007. Also, there were adequate supplies of forages in the province, due mainly to the high tame hay production in 2007. As to quality, feed grains and forages were mostly rated as good to excellent.
Feed grains
As mentioned earlier, total barley production in Alberta in 2007 was significantly higher than in 2006. However, due to a low carry-over from the 2006/07 crop year and the increased use of grains for ethanol production, supplies of feed grains in both domestic and international markets were tight. As a result, prices for feed grains jumped substantially in 2007, compared to a year earlier.
In general, producers in the province reported adequate supplies of feed grains. The majority of feed grains purchased were from nearby farms and other regions of the province. Some producers also sourced their supplies of feed grains from Saskatchewan, Manitoba, British Colombia, and Ontario. As well, significant amounts of US corn were imported.
Overall, for the province, survey respondents rated feed barley supply as one percent deficit, seven percent possible shortfall, 66 percent adequate, and 26 percent surplus, with a similar distribution reported for feed oats. The supply of feed wheat was reported as three percent possible shortfall, 61 percent adequate, and 36 percent surplus. Regarding quality, about 77 percent of feed barley, 79 percent of feed oats, and 82 percent of feed wheat were reported as good to excellent.
Forages
Due to the adequate moisture reserves in May and June, most producers in the province had an excellent hay crop in 2007. The high tame hay production, coupled with the greenfeed and silage harvested from annual cereals, provided an abundant supply of forages. In general, survey respondents reported adequate or surplus supplies of forages. The majority of forages purchased came from nearby farms.
Overall, more than 95 percent of survey respondents reported adequate or surplus supplies of tame hay, greenfeed, straw for feed, and straw for bedding. Supplies were even better for silage, with 97 percent of survey respondents reporting having enough or surpluses. With respect to quality, nearly 78 percent of tame hay, 85 percent of greenfeed, and 92 percent of silage were rated as good to excellent. Also, producers reported that 90 percent of straw for feed and 91 percent of straw for bedding were in good to excellent condition.
Alberta Crop Production Table
Table 1: Alberta Crop Production ('000 tonnes) |
|
2002 |
2003 |
2004 |
2005 |
2006 |
2007 | 10 year
average | % change |
07 vs 06 | 07 vs avg |
| Winter Wheat | 29.9 | 144.2 | 196.0 | 190.5 | 167.4 | 175.5 | 103.0 | 5% | 70% |
| Spring Wheat | 2,594.4 | 5,278.4 | 6,392.9 | 7,160.3 | 6,678.7 | 5,230.6 | 5,907.0 | -22% | -11% |
| Durum Wheat | 898.1 | 1,007.0 | 982.5 | 1,020.6 | 657.3 | 670.0 | 873.0 | 2% | -23% |
| All Wheat | 3,522.4 | 6,429.6 | 7,571.4 | 8,371.4 | 7,503.4 | 6,076.1 | 6,883.0 | -19% | -12% |
| Oats | 370.1 | 826.6 | 828.2 | 829.7 | 706.3 | 627.4 | 756.0 | -11% | -17% |
| Barley | 2,547.4 | 5,421.3 | 5,628.2 | 5,231.9 | 4,404.6 | 5,114.3 | 5,184.0 | 16% | -1% |
| Fall Rye | 14.2 | 76.2 | 68.6 | 79.0 | 57.2 | 36.8 | 60.0 | -36% | -39% |
| Mixed Grains | 16.3 | 40.8 | 44.9 | 40.8 | 65.9 | 24.1 | 53.0 | -63% | -55% |
| Flaxseed | 20.3 | 25.4 | 29.2 | 53.3 | 36.3 | 16.3 | 31.0 | -55% | -47% |
| Canola | 1,224.7 | 2,222.6 | 2,925.7 | 3,651.4 | 3,424.6 | 2,993.7 | 2,451.0 | -13% | 22% |
| Dry Peas | 221.6 | 491.3 | 642.3 | 617.5 | 552.6 | 527.5 | 517.0 | -5% | 2% |
| Mustard Seed | 19.1 | 38.8 | 51.2 | 31.1 | 25.6 | 27.0 | 32.3 | 5% | -16% |
| Chick Peas | 15.9 | 13.2 | 8.6 | 19.6 | 26.0 | 26.7 | 17.4 | 3% | 53% |
| Triticale | 8.3 | 30.1 | 27.9 | 21.8 | 15.0 | 17.8 | 32.0 | 19% | -44% |
| Sugar Beets | 422.4 | 628.1 | 740.5 | 668.1 | 963.2 | 762.0 | 731.5 | -21% | 4% |
| Fodder Corn | 362.9 | 453.6 | 340.2 | 453.6 | 952.5 | 839.1 | 408.0 | -12% | 106% |
| Tame Hay | 3,039.1 | 6,395.7 | 7,393.6 | 8,754.3 | 8,142.0 | 9,276.0 | 5,949.0 | 14% | 56% |
| Total | 11,804.7 | 23,093.3 | 26,300.5 | 28,823.5 | 26,875.2 | 26,364.8 | 23,105.2 | -2% | 14% |
Totals may not add up due to rounding.
10-year average refers to 1997 to 2006. |
| Source: Statistics Canada, and Alberta Agriculture and Rural Development. |
Table 2: Alberta Crop Area and Yield |
| 2006
seeded | 2006
hrvtd | 2006
yield | 2007
seeded | 2007
hrvtd | 2007
yield | 10 year
avg yld | Yield % change |
07 vs 06 | 07 vs avg |
| | ('000 acres) | (bu/acre) | ('000 acres) | (bu/acre) | (bu/acre) |  |
| Winter Wheat | 128 | 120 | 51.3 | 160 | 140 | 46.1 | 43.9 | -10% | 5% |
| Spring Wheat | 5,769 | 5,685 | 43.2 | 4,867 | 4,785 | 40.2 | 39.5 | -7% | 2% |
| Durum Wheat | 571 | 565 | 42.7 | 765 | 760 | 32.4 | 36.2 | -24% | -10% |
| All Wheat | 6,468 | 6,370 | 43.3 | 5,792 | 5,685 | 39.3 | 39.1 | -9% | 1% |
| Oats | 1,269 | 705 | 65.0 | 1,050 | 620 | 65.6 | 67.3 | 1% | -3% |
| Barley | 4,095 | 3,400 | 59.5 | 4,850 | 4,270 | 55.0 | 58.0 | -8% | -5% |
| Fall Rye | 105 | 55 | 40.9 | 70 | 40 | 36.3 | 36.9 | -11% | -2% |
| Mixed Grains | 373 | 60 | 53.8 | 140 | 20 | 59.0 | 53.1 | 10% | 11% |
| Flaxseed | 60 | 55 | 26.0 | 30 | 30 | 21.3 | 22.8 | -18% | -7% |
| Canola | 4,500 | 4,480 | 33.7 | 4,500 | 4,460 | 29.6 | 28.8 | -12% | 3% |
| Dry Peas | 587 | 565 | 35.9 | 610 | 595 | 32.6 | 35.5 | -9% | -8% |
| Mustard Seed | 63 | 60 | 18.8 | 85 | 85 | 14.0 | 15.3 | -25% | -8% |
| Chick Peas | 41 | 40 | 23.9 | 50 | 50 | 19.6 | 18.5 | -18% | 6% |
| Triticale | 76 | 15 | 39.3 | 40 | 18 | 38.9 | 39.9 | -1% | -3% |
| | | | (tons/acre) | | | (tons/acre) | (tons/acre) | | |
| Sugar Beets | 38 | 37 | 28.6 | 34 | 34 | 24.7 | 22.8 | -14% | 8% |
| Fodder Corn | 70 | 55 | 19.1 | 70 | 50 | 18.5 | 16.3 | -3% | 13% |
| Tame Hay | 6,241 | 5,450 | 1.6 | 6,240 | 5,585 | 1.8 | 1.2 | 13% | 50% |
| Total | 23,985 | 21,347 | - | 23,561 | 21,542 | - | - | - | - |
|
hrvtd - harvested
avg - average
yld - yield
Totals may not add up due to rounding. |
| Source: Statistics Canada, and Alberta Agriculture and Rural Development. |
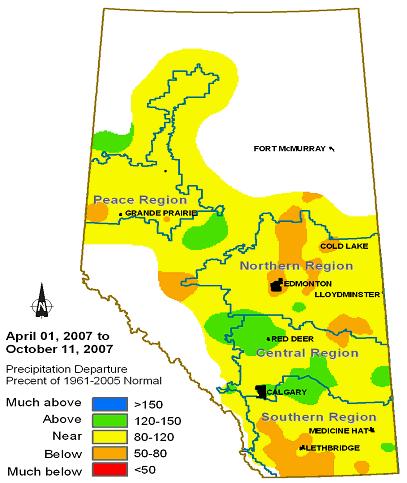
Precipitation Map
 |
|