| | The rainfall simulator that we use | How can a rainfall simulator duplicate real storms? | Study locations
The Rainfall Simulator that We Use
The rainfall simulator that we built is essentially a calibrated nozzle suspended by a tripod over a 1 m2 plot area (Figure 1). It is based on the GRS II design that was calibrated and compared with natural rainfall. It allows us to measure the effects of rainfall in undisturbed field conditions. The simulator delivers water over a frame-contained plot. Different rainfall intensities can be simulated by changing the nozzle size, its height over the soil, and the water pressure. Different storm severities can be approximated by adjusting the length of time of the simulated storm.
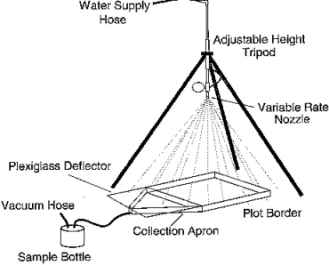
Figure 1. Schematic of the GRS II rainfall simulator
We investigated the relationship between soil loss from natural and simulated rainstorms, and we found that, with some adjustments, our simulated soil loss was close to natural. We found that an intensity of 60 mm h-1 ( 4 inches hr-1) was a good choice to represent Alberta storms. Running the simulator at 60 mm h-1 for 20 minutes roughly mimics a storm that occurs about every other year in Alberta (a one in two year storm).
During each simulation, all runoff (sediment and water) that runs off of the plot is suctioned into sample bottles. Runoff subsamples are collected for up to 1 minute every 3 minutes. Soil loss subsamples are then used to create curves of cumulative soil loss (Figure 2). The process is duplicated for runoff and infiltration. These curves can then be used as the basis for calculating amounts of erosion, runoff or infiltration at simulation times representing various types of storms. As such, one simulation curve can be used as the basis for approximating any rainstorm, e.g. a series of historic storms, an average storm, or an extreme storm.
Figure 2. Cumulative soil loss from simulated rainfall at 60 mm h-1 in conventional (CT), reduced (RT) and zero tillage (ZT) conditions. Bars represent standard error
Further details may be found in:
Nolan, S.C, van Vliet,L.J.P. , Goddard, T.W. and Flesch, T.K.1997. Estimating storm erosion with a rainfall simulator. Can. J. of Soil Science. 77(4):669-676.
Tossell, R.W., Dickinson, W.T., Rudra, R.P., and Wall, G.J. 1987. A portable rainfall simulator. Can. Agric. Eng. 29:155-162.
Tossell, R.W., Wall, G.J., Rudra, R.P., Dickinson, W.T. and Groenevelt, P.H. 1990. The Guelph Rainfall Simulator II: Part 2-Comparison of natural and simulated rainfall characteristics. Can. Agric. Eng. 32:215-223.
How Can a Rainfall Simulator Duplicate Real Storms?
An important first stage of our work was determining how well rainfall simulators match real storms in terms of "erosiveness". In the Peace River region, we found that, properly interpreted, soil loss generated with our rainfall simulator was within 12 % of soil loss from a series of natural rainstorms (Figure 3) in conventional, reduced and zero till (direct seeded) conditions. This occurred after we adjusted for: i) the lower kinetic energy of simulated rainfall, ii) the smaller plot length of the simulator, and iii) calculated simulator erosivity only after runoff began. This means that a rainfall simulator, coupled with climatological information, can be used to approximate the erosivity of storms representing for instance: an average rainstorm, or a typical one in ten year storm.
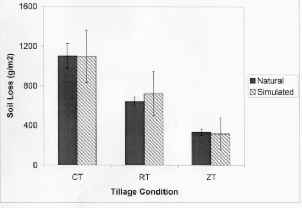
Figure 3. Soil loss from five years of natural springtime erosion compared with simulated soil loss after adjustments for kinetic energy, plot size and runoff start time in conventional (CT), reduced (RT) and zero tillage (ZT) conditions.
We have calculated that running the rainfall simulator at an intensity of 60 mm h-1 for 20 minutes mimics the energy of roughly a one in two year storm in Alberta. A one in two year storm occurs on average every other year. These results are based on detailed rainfall measurements from central Alberta.
More details of our methods and results of relating simulated and natural rainfall are available in:
Nolan, S.C., van Vliet, L.J.P., Goddard, T.W. and Flesch, T.K. 1997. Estimating storm erosion with a rainfall simulator. Can. J. of Soil Science. 77(4):669-676.
Study Locations
We undertook a study of how soil, climatic, residue and management conditions which are unique to Alberta influence water erosion. We selected study sites on farmer's fields which represented a range of typical agricultural conditions and common practices. The site locations characterized by study type are illustrated below.
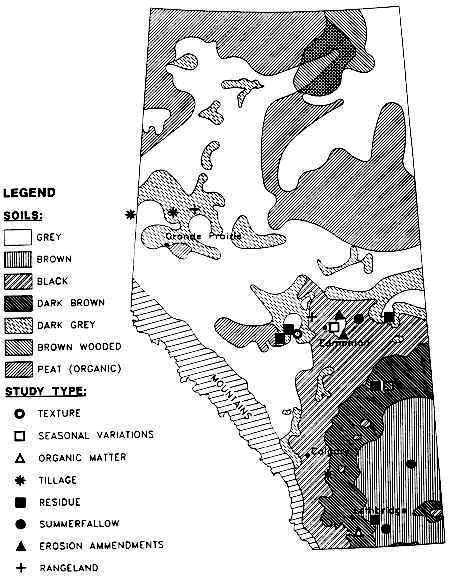
Location of rainfall simulator study site locations (1990-1997)
This information is provided by Sheilah Nolan and Tom Goddard. |
|