| | Introduction | Objectives |Greenhouse preparation |System set-up |Results and discussion | Media weight and leaf canopy |Volumetric water content |Leaf temperatures |PAR Readings |Conclusion |
Installation of Automated Crop Monitoring System in Production Greenhouses, Brooks-Alberta
Nabeel Mohammed, Len Hingley, Ted Harms, Gil Dufresne and John Zhang
Alberta Agriculture and Rural Development
Greenhouse Research and Production Complex
Introduction
Good crop management depends on having the right information to make necessary decisions. Climate and substrate sensors are used in commercial greenhouses to provide up-to-the-minute information about the greenhouse environment. Sensors for incident light, temperature, and humidity provide climate information while sensors for pH, Electrical Conductivity (EC) and media moisture content provide information on the root-zone environment. These sensors furnish information for record keeping and control purposes. However, they provide only indirect information on the status of the crop. Physiological information could provide important supplementary data, especially if integrated into control systems or computer models. (Ehret et al., 2011). A range of physiological parameters such as growth, photosynthesis, transpiration, and leaf temperature may be automatically monitored with a variety of instruments, either remotely or through physical contact (Ehret et al., 2001).
Data derived from crop monitoring could be used to compare crops over time and space and to supplement environmental information used in greenhouse computer control. There are a number of requirements to be met if a crop monitoring system to be used in a commercial greenhouse setting, the equipment should be capable of recording data continuously and automatically; it must be non-invasive, robust, and integrate with greenhouse crop management and practices; it should be capable of monitoring groups of plants rather than a single plant or plant brb
part to provide more representative crop data; lastly, it should provide useful measurements that the grower cannot easily obtain using other techniques.
Objectives
- To evaluate sensor application, information on measurements associated with crop response to changes in substrate moisture, weight and variations within the plant growth in greenhouse vegetable crops.
- To operate and evaluate whether these sensors are suitable for the greenhouse use and to provide data that will assist the irrigation and environmental management of the crops based on the data from these sensors.
System components and installation:
The sensors shown in (Figure 1) are:
- Upper load cell.
- Lower load cell.
- CS655 (water content reflectometer probe).
- Apogee IRR-P (Infrared temperature sensor).
- PAR (Photosynthetically Active Radiation).
Figure 1 Sensors of the crop monitoring system in greenhouse poly # 2.
Also there is:
- A datalogger CR3000 (Campbell Scientific Canada Corp, Edmonton, AB) provided all data collection functions from the sensors. The datalogger communicated with the PC via a communication cable (Figure 2).
- The multiplexer AM16/32B provides a connection of the load cells (to the datalogger for measurement and data acquisition /processing).
- The NL115 to connect the datalogger to an Ethernet network and transfer data to the base station for remote monitoring.
- The ENC 16"x18" enclosure (white box) to house the CR3000 and the multiplexer.
- Power supplies for communication between the sensors, datalogger and computer room.
- Fiber-optic cable for faster transferring of the information to the computer room.
- Two trays containing the plants.
- Two stations of the soilless growing medium (coconut coir and biochar).
Figure 2 Flow chart of the crop monitoring system in greenhouse poly # 2.
- Loggernet 3.4.1. (Figure 3) a Campbell Scientific program was used to collect data generated by the CR 3000 and transfer to a source file on the PC.
Figure 3 Loggernet software of the crop monitoring system in greenhouse poly # 2.
- The real time data from the upper, lower load cells, PAR, IRR and CR655 can be display automatically every 15 minutes, hourly, daily, weekly intervals throughout the growing season either graphically or in tables, and is also archived. The datalogger memory 2MB, can store several weeks of data from a single site.
- The datalogger was programmed to sample all instruments readings every 20 seconds and store the sample value of these results every 15 minutes and average every hour.
- The system will illustrate the measurements in tables for both stations (coco # 1) and (biochar #2) as the following in (Table 1) except the biochar station there is no CS655 sensor.
Table1 System Measurements.
| Sensor | Application | Measurement unit |
| Upper Load Cell | LC_Canopy1_Avg. | Kg |
| Lower Load Cell | LC_Media1_Avg. | Kg |
| PAR | Quantum 1_Avg. | �mol m-2 s-1. |
| IRR-P | SBTempC_1_Avg (Sensor Body Temperature). | �C |
 | TBTempC_1_Avg (Target Body Temperature). | �C |
| CS655 | VWC Avg (Volumetric Water Content). | m^3/m^3. |
| EC Avg (Electrical Conductivity). | dS/m |
| Tsoil Avg (Substrate Temperature). | �C |
Greenhouse preparation
One greenhouse compartment (poly # 2) located at the greenhouse research and production complex (GRPC) at Brooks, Alberta was used for the installation of two stations of the crop monitoring system. Peppers plants variety (DRS.0710) were planted in October 2012 using coco substrate while the sympathy variety with the biochar substrate were planted in November 2012. Each growing medium had 6 plants /slab, 1 dripper/plant, 6 drippers /slab and the volume of the drip lines was 2 L/hour. Plants were chosen which are generally representative of the crop and they were not close to a wall or walkway. All plants were irrigated with the same formula of nutrient solution prepared by nutrient management in the Brooks greenhouse research and production complex program. The E.C (Electrical Conductivity) and pH for the nutrient solution were measured during the experiment. The feed stock solutions and irrigation management was monitored by Argus and adjusted according to the lab analysis. Climate set points like temperature, light; CO2 and relative humidity were controlled by the Argus computer system. Each station consisted of one substrate either coconut coir or biochar, a pair of upper and lower load cells, one PAR. and one IRR-P sensors. The coconut coir station had a CS655 probe installed to monitor the substrate water content, E.C and root zone temperature.
System set-up
The system was set up to use five different sensors shown in figure 1, are connected to a datalogger. The datalogger was programmed to maintain the substrate measurements which including:
- Upper load cell set-up An upper load cell set weighs the crop canopy for continuous measurements of daily growth (midnight to midnight).The plants were tied to a beam placed parallel to the crop wire but suspended from the load cells. The pair of the upper load cells are S–beam tension cells (AnyLoad Transducers, Model 101NSGS, BC, Canada), each load cell had a capacity of 50 kg. The upper load cells were suspended with metal chains to minimized lateral stress on the load cells which is a requirement for accurate readings. The measurements of the upper load cells included change in canopy weight (stems, fruits, flowers, leaves) mass.
- Lower load cell set-up A set of lower load cells (weight scales) were used to monitor the plants growth weight gain (water contributing to growth).The substrate containing the plants is positioned on top of two single point load cells (AnyLoad Transducers, Model 108KSUN, BC, Canada), each with 50kg capacity The upper and lower load cells utilized the same plants. Load cell output was expressed in kilograms. The measurements of the lower load cells included: Weight of the crop growing medium.
- CS655 water content Reflectometer set-up
- Coconut coir substrate:
- The probe CS655 (Campbell Scientific Canada Corp, Edmonton, AB) with the 12 cm rods was used for measuring the:
- Volumetric Water Content (expressed in m3 m–3), the probe provides information on the degree of saturation of the media.
- Electrical Conductivity (EC) expressed in dS/m (mS/cm).
- Temperature (�C).of the growth medium (soilless substrate).
- Biochar substrate
- Neither the CS655 probe nor a Hydra digital (Hoskin Scientific Limited, B.C Canada) gave substrate water readings for the biochar. It was presumed the inability of the probes to function in the biochar medium was due to elevated E.C values.
- Apogee IRR-P (Infrared temperature sensor) set-up It measures the temperature at the top of the crop, which to a large extent determines the crop’s growth rate. The sensor was mounted at an appropriate distance from the target and is expressed in unit of degree Celsius (�C).They are useful tools as an indicator of plant stress.
- Quantum sensor set-up It measures the number of photons in the photosynthetically active radiation (PAR) spectrum, which is light with a wavelength between 400 to700 nanometer; providing the energy for plant photosynthesis. The more PAR a plant receives, the more potential that plant has for growth. The unit of measurement is micromoles per square meter per second (�mol m-2 s-1). Their placement at the top point in the plant canopy provides an immediate indication of whether the current light levels are sufficient or not.
Results and discussions
Using a combination of sensors, close relationships between irrigation timing and quantity, greenhouse environment controls can be use to improve the plant management.
Media weight & leaf canopy of coconut and biochar substrates (Figures 4, 5, 6, 7, 8 & 9)
The differences result caused by changes in the amount of water use throughout the growth of the crop, changes in environmental conditions, harvesting the yield or crop size.
Large changes in canopy weight over short intervals can be used to identify harvests, de-leafing or irrigation events.
The daily or hourly differences in the weight of the growing medium are almost due to changes in water content. Large drops in the media weight occurred whenever excess nutrient solution (leachate) is moved from the tray. Small changes in weight over short intervals during the growing events occurred as the result of plant water use.
During the growing events there are changes in the leaf canopy weight between the 2 stations because the type of the growing medium, plant growth and also from difference between plants water use and harvesting.
Figure 4. Growing medium & leaf canopy weights of the coconut coir substrate during the July 15, 2013 in poly # 2.
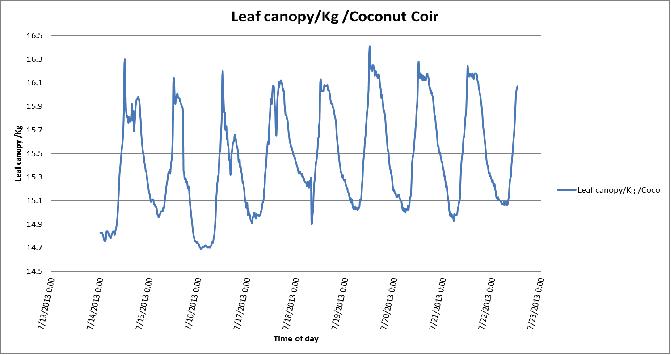
Figure 5. Day-to-day variation in leaf canopy weights of the coconut coir substrate in poly # 2.
Figure 6. Day-to-day variation in growing medium weights of the coconut coir substrate in poly # 2.
Figure 7. Growing medium & leaf canopy weights of the biochar substrate during July 16, 2013 in poly # 2.
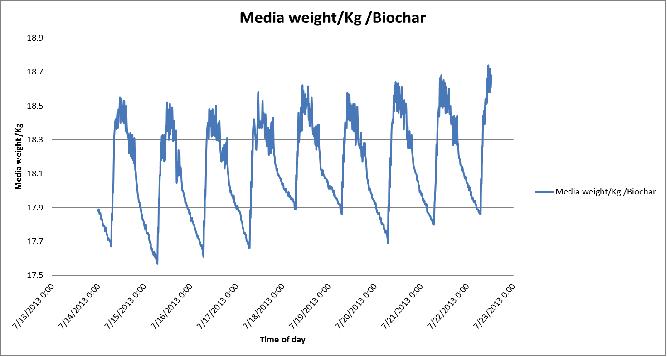
Figure 8 Day-to-day variation in growing medium weights of the biochar substrate in poly # 2.
Figure 9. Day-to-day variation in leaf canopy weights of the biochar substrate in poly # 2.
Volumetric water content (Figures 10, 11, 12, & 13)
Checking VWC graph (figure 11) during hot day and night periods is critical to ensure the substrate does not dry down too far. The time at which the plants start to transpire can be seen by a change in slope of the VWC curve shortly after the sunrise.
- The first irrigation start 2 hours after dawn, from that time to the point of first drain there is increase in the substrate water content (VWC) and E.C (figure 8).
- Relationships shown here in the graph (figure 11) that the VWC will be stable and decreasing in the substrate E.C as the point of drain realised. This period normally transcends the point of highest solar radiation.
- From last irrigation in day 1 (2 hours before dusk) to first irrigation in day 2 there will be decreasing in the VWC and increasing in the EC.
- The measuring by CS655 probe showed increase in E.C with decreasing in the water content as the fertilizers in the pore water become more diluted as VWC increases.
- The water content of the plant increases by water uptake by the roots and decreases by transpiration.
- Daily fluctuations in water use will result in fluctuations in substrate volumetric water content, when plant water use is high, substrate water content will drop quickly.
Figure 10 Volumetric water content & Electrical conductivity (E.C) of the coconut coir substrate during July 16, 2013 in poly # 2.
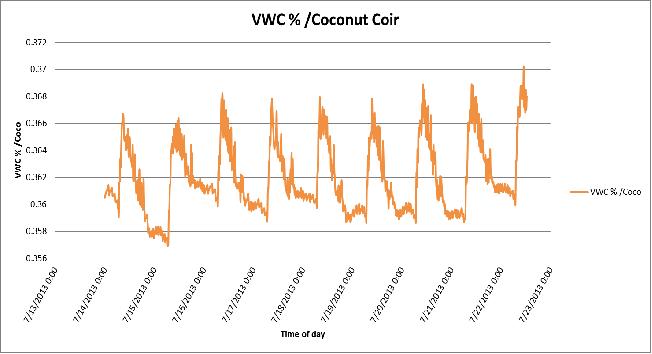
Figure 11 Day-to-day variation in Volumetric Water Content (VWC %) of the coconut coir substrate in poly # 2.
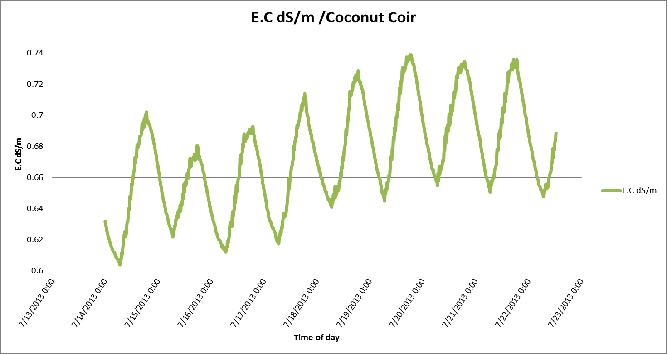
Figure 12 Day-to-day variation in Electrical conductivity (E.C) of the coconut coir substrate in poly # 2.
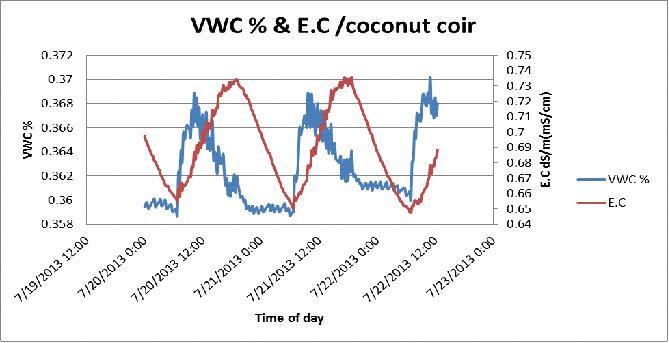
Figure 13 Day-to-day variation in Volumetric Water Content (VWC %) & Electrical conductivity (E.C) of the coconut coir substrate in poly # 2.
Leaf temperature (Figures 14, 15, 16, 17, 18, 19& 20):
Leaf temperature is a good indicator of transpiration, measuring the difference between leaf temperature and ambient air temperature is the best indications of plant stress from heat, light and lack of water. With high light, the leaf temperature will also be higher and that is important for photosynthesis, stomata (tiny pores in the epidermis of leaves) opening and respiration. Leaf temperature has a direct effect on the opening and closing of stomata, decreased water uptake closes stomata, which then reduces transpiration and increases leaf temperature.
- Both coconut coir and biochar stations (Table 2), the plants leaf temperature increased above the air temperature a few times because of the absorbed radiation.
- Leaf temperatures increased (2-3�C) during the afternoon because there was less cooling by transpired water as it evaporated from the leaf surfaces.
- Plant leaf temperatures will generally be warmer than air temperatures by day (around afternoon) but at night was slightly cooler (1-2�C) less than greenhouse air temperature.
Figure 14 Plant leaf temperature in the coconut coir substrate during July 15, 2013 in poly # 2.
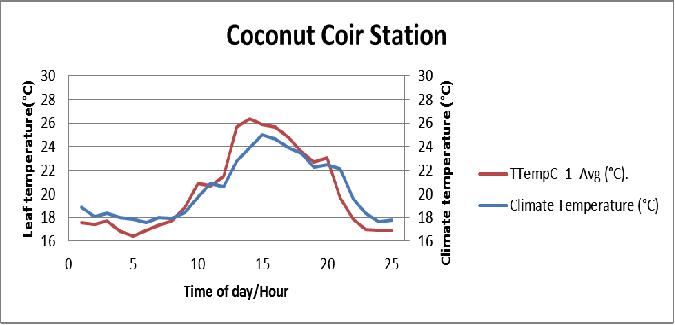
Figure 15 Comparison between the plant leaf temperature of the coconut coir substrate and greenhouse air temperature during July 15, 2013 in poly # 2.
Figure 16 Plant leaf temperature in the biochar substrate during July 15, 2013 in poly # 2.
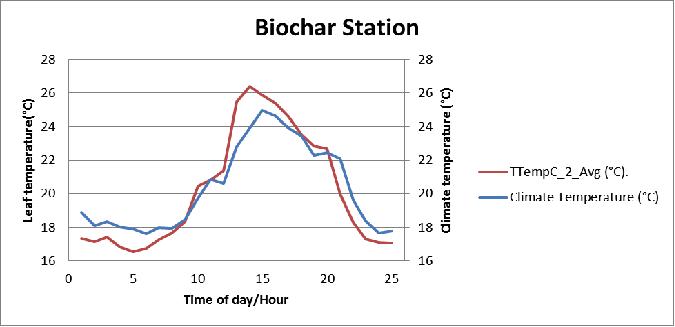
Figure 17 Comparison between the plant leaf temperature of the biochar substrate and greenhouse air temperature during July 15, 2013 in poly # 2.
Figure 18 Plant leaf temperatures of the coconut coir & biochar substrates during July 15, 2013 in poly # 2.
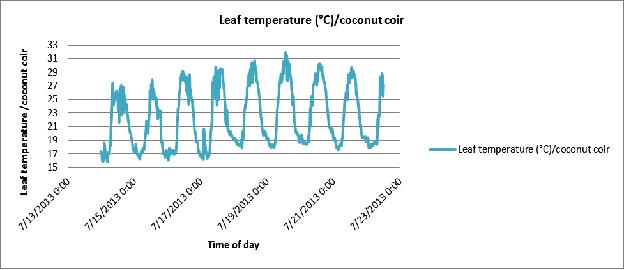
Figure 19 Day-to-day variation in plant leaf temperature of the coconut coir substrate in poly # 2.
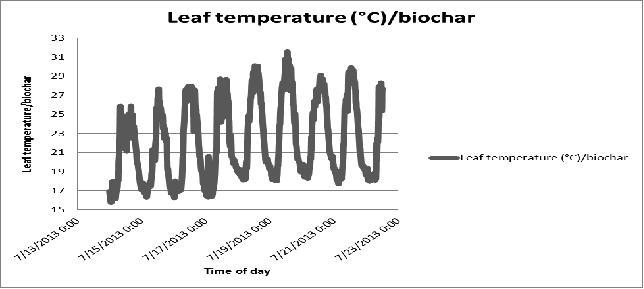
Figure 20 Day-to-day variation in plant leaf temperature of the biochar substrate in poly # 2.
Table 2 Greenhouse & plant leaf temperatures of coconut coir and biochar stations during July 15, 2013 in poly # 2.
| Date &Time | Climate Temperature/
Argus control | TTempC_1_Avg/
coconut coir | TTempC_2_Avg/
biochar |
| 2013/07/15, 00:00:00 | 18.9 | 17.55 | 17.35 |
| 2013/07/15, 01:00:00 | 18.1 | 17.45 | 17.15 |
| 2013/07/15, 02:00:00 | 18.35 | 17.72 | 17.41 |
| 2013/07/15, 03:00:00 | 18.02 | 16.89 | 16.82 |
| 2013/07/15, 04:00:00 | 17.9 | 16.44 | 16.53 |
| 2013/07/15, 05:00:00 | 17.61 | 16.92 | 16.75 |
| 2013/07/15, 06:00:00 | 17.98 | 17.36 | 17.26 |
| 2013/07/15, 07:00:00 | 17.93 | 17.71 | 17.66 |
| 2013/07/15, 08:00:00 | 18.47 | 18.84 | 18.33 |
| 2013/07/15, 09:00:00 | 19.72 | 20.87 | 20.45 |
| 2013/07/15, 10:00:00 | 20.86 | 20.67 | 20.81 |
| 2013/07/15, 11:00:00 | 20.61 | 21.46 | 21.36 |
| 2013/07/15, 12:00:00 | 22.8 | 25.64 | 25.48 |
| 2013/07/15, 13:00:00 | 23.9 | 26.35 | 26.38 |
| 2013/07/15, 14:00:00 | 24.97 | 25.86 | 25.87 |
| 2013/07/15, 15:00:00 | 24.65 | 25.62 | 25.39 |
| 2013/07/15, 16:00:00 | 23.91 | 24.77 | 24.61 |
| 2013/07/15, 17:00:00 | 23.43 | 23.55 | 23.51 |
| 2013/07/15, 18:00:00 | 22.29 | 22.71 | 22.86 |
| 2013/07/15, 19:00:00 | 22.45 | 23.04 | 22.68 |
| 2013/07/15, 20:00:00 | 22.1 | 19.64 | 19.98 |
| 2013/07/15, 21:00:00 | 19.61 | 17.88 | 18.28 |
| 2013/07/15, 22:00:00 | 18.39 | 17.01 | 17.29 |
| 2013/07/15, 23:00:00 | 17.67 | 16.94 | 17.1 |
| 2013/07/16, 00:00:00 | 17.79 | 16.95 | 17.04 |
PAR readings (Figures 21, 22, 23, 24, & 25):
Depends on the light intensity more sunlight means higher inside temperatures, higher ventilation requirements and higher irrigation needs.
- Plants need light (PAR), so increasing energy in the PAR range increases plant photosynthesis. The differences in PAR readings (Table 3) between the stations due to the location of the station, using the shade inside the greenhouse and the filtering of radiation by the greenhouse covering.
- Both photosynthesis and transpiration are dependent on solar radiation; more radiation means more CO2 uptake and also more transpiration.
- Along with daily (photosynthetically active radiation) and more radiation, water use tends to increase during the production cycle, as a result of increasing plant size.
Figure 21 PAR readings of the coconut coir substrate during July 15, 2013 in poly # 2.
Figure 22 PAR readings of the biochar substrate during July 15, 2013 in poly # 2.
Figure 23 PAR readings of the coconut coir & biochar substrates during July 15, 2013 in poly # 2.
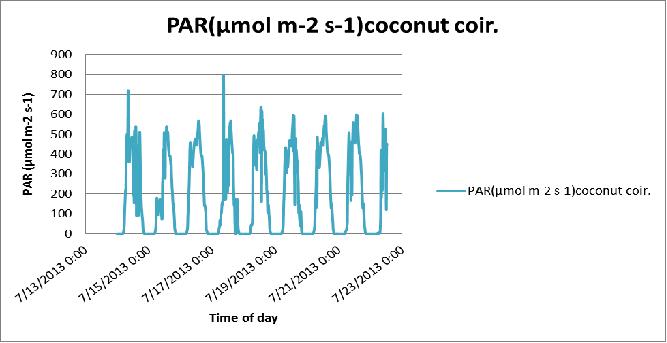
Figure 24 Day-to-day variation in the PAR of the coconut coir substrate in poly # 2.
Figure 25 Day-to-day variation in the PAR of the biochar substrate in poly # 2.
Table 3 PAR readings & outdoor lights of coconut coir and biochar stations during July 15, 2013 in poly # 2.
| Date &Time | Outdoor Light/
Argus control-W/m2 | Quantum1_Avg/coconut coir/
�mol m-2 s-1 | Quantum2_Avg/biochar/
�mol m-2 s-1 |
| 2013/07/15, 00:00:00 | 0 | 0 | 0 |
| 2013/07/15, 01:00:00 | 0 | 0.001 | 0 |
| 2013/07/15, 02:00:00 | 0 | 0.003 | 0 |
| 2013/07/15, 03:00:00 | 0 | 0.002 | 0 |
| 2013/07/15, 04:00:00 | 0 | 0.022 | 0.012 |
| 2013/07/15, 05:00:00 | 0 | 3.175 | 4.076 |
| 2013/07/15, 06:00:00 | 10 | 53.16 | 46.02 |
| 2013/07/15, 07:00:00 | 134 | 148 | 139.8 |
| 2013/07/15, 08:00:00 | 85 | 126.2 | 166.4 |
| 2013/07/15, 09:00:00 | 107 | 147.4 | 191 |
| 2013/07/15, 10:00:00 | 121 | 116 | 150.4 |
| 2013/07/15, 11:00:00 | 51 | 190.1 | 251.2 |
| 2013/07/15, 12:00:00 | 380 | 458.2 | 634 |
| 2013/07/15, 13:00:00 | 602 | 438 | 572.3 |
| 2013/07/15, 14:00:00 | 713 | 509.9 | 644.2 |
| 2013/07/15, 15:00:00 | 669 | 485.4 | 641.9 |
| 2013/07/15, 16:00:00 | 581 | 394.2 | 596.4 |
| 2013/07/15, 17:00:00 | 477 | 355.2 | 441.7 |
| 2013/07/15, 18:00:00 | 256 | 251.3 | 265 |
| 2013/07/15, 19:00:00 | 222 | 158.6 | 165.4 |
| 2013/07/15, 20:00:00 | 89 | 64.55 | 71.41 |
| 2013/07/15, 21:00:00 | 0 | 4.704 | 6.339 |
| 2013/07/15, 22:00:00 | 0 | 0.036 | 0.031 |
| 2013/07/15, 23:00:00 | 0 | 0.01 | 0 |
Conclusions
This system currently monitors two stations in the greenhouse, provides real-time data generated by a datalogger, automatically and continually gathers information from the sensors every 15 minutes, hourly, daily and weekly. The system is successful in measuring the volumetric water content (VWC), E.C, and temperature of the coconut coir substrate, PAR, leaf temperature, media weight and the mass of the canopy growth throughout the life of a greenhouse crop.
It was difficult to get readings of the volumetric water content (VWC), E.C, and temperature from the biochar substrate when using the water content reflectometer sensor (CS655) and Hydra probe. The next step will be the installation of GS 3 probe ((Decagon Devices, US) to attempt to obtain those measurements.
The system is simple, reliable and low maintenance. As these results are based on a small number of measurements, but they are encouraging to do more research and make comparison between the zones, so next season there is an opportunity to expand this network, install the CS655 probes, other sensors, dataloggers, conduct more measurements in different production greenhouses from the early stage of development throughout the growth period and see the differs of the results.
Future work
- Based on the decision of the greenhouse manager on that system, may be in the next growing season, September 2013,it is a good idea to try use the same system with Red-Hat trials on testing the plant growth of high wire cucumbers in poly # 2 and use different technique of upper load cells. Later on (January 2014) we will do another comparison of two seasons and years for peppers crop.
- For crops such as tomato, we can use the other sensors but it is impractical to continuously use the same set of plants on the upper load cells for extended periods of time, because of lowering the plants on regular basis and by the end of the season the plant canopy may be over 10m from its roots. So it's better to choose different kind of load cells like weigh the whole plants on the trough instead of an individual plant.
- In future experiments, we need to examine the relationship of the sensors we are currently using, and the effect of the environmental conditions (sunny and cloudy days) like solar radiation, relative humidity, CO2, greenhouse temperature, VPD and irrigation strategies (volume, start and stop time of watering) on the yield and crop performance in the greenhouse.
- Extend the system by evaluating different technology like Priva top crop or Paskal growth analysis system.
- Do the integration of GS 3 probe ((Decagon Devices, US) that with Argus software and view the information of the substrate water status in the Argus computer.
References:
Ehret, D.L., Lau, A., Bittman, S., Lin, W., Shelford, T., 2001. Automated monitoring of greenhouse crops. Agronomie 21, 403–414.
Ehret, D.L., Hill, B.D.,T, Helmer.,Edwards,D.R.,2011., Neural network modeling of greenhouse tomato yield, growth and water use from automated crop monitoring data.
Acknowledgements:
I am very grateful to Len Hingley for the programming, wiring the system and his help for the installation. I wish to thank Ted Harms, Roland William and Gil Dufresne for their invaluable help and advice. |
|