| | Overview:
After 6 years of seeing “grass and legume seed acres for certification” fall, 2012 finally saw a gain in acres. Since 2006, which saw over 185,000 acres of foundation (or higher grade) seed fields being inspected for certification, inspections
| had fallen to a low of 126,000 acres in 2011. 2012 saw acres inspected for certification increase to over 131,000 acres, a modest 5% increase from the previous year, but a turn in the right direction. However, when one looks at what crops were responsible for this slight increase, one can see the reaction to market conditions for the various crops. |  |
Acres of Alfalfa seed, Birds-foot trefoil seed, and timothy seed fields, grown for certification, all increased. Compared to 2011, Alfalfa acres increased by over 5,000 acres, birds-foot trefoil by 2,300 acres and timothy seed fields by 7,000 acres. The birds-foot trefoil inspected acres are the highest in at least the past 8 years.
In contrast to the crops showing positive growth in acres, other crop species saw acres drop dramatically, with ryegrass seed acres falling by over 5,500 acres. 2012 also saw 1,200 less wheatgrass acres applied for inspection, while acres of brome grasses fell by 1,000 from the previous year.
2012 Canadian Acres Inspected for Certification |
| Crop Kind | Maritimes/Que/Ont | MB | SK | AB | BC | 2012 | 2011 |
| Alfalfa |  | 8,849 | 16,654 | 21,953 | | 47,456 | 44,114 |
| Birdsfoot Trefoil | | 6,100 | 1,215 | | | 7,315 | 5,010 |
| Bromegrass | | 608 | 1,145 | 3,277 | 108 | 5,138 | 6,433 |
| Clover | | 942 | 1,008 | 1,936 | | 3,886 | 3,559 |
| Fescue | | 3,499 | 295 | 6,641 | 440 | 10,875 | 10,422 |
| Ryegrass | 25 | 17,172 | 972 | 300 | | 18,469 | 23,974 |
| Timothy | 1 | 15,076 | 3,305 | 12,157 | 2,473 | 33,012 | 25,918 |
| Wheatgrass | | | 1,795 | 3,495 | | 5,290 | 6,248 |
Total | 26 | 52,246 | 26,389 | 49,759 | 3,021 | 131,441 | 125,678 |
Additional Comments:
- Manitoba and Alberta continue to be the heartland of certified grass and legume seed production, with both provinces growing close to 50,000 acres. 2012 saw Saskatchewan growers seed over 26,000 acres of seed for certification.
| - The economic turmoil which accompanied the 2008 world financial crisis and subsequent depressed housing market in North America can still be seen in the certified turf seed market. Production acres of both creeping red fescue and the ryegrasses, are both still well below the 9 year average. 2012’s inspected acres of creeping red fescue and the ryegrasses (mainly perennial) were at 10,800 and 18,400 acres respectively. However, the average inspected acres over the past 9 years for these two crops have been 19,000 and 26,600 acres respectively. | 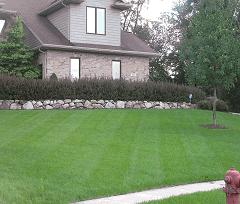 |
- Clover seed fields grown for certified seed increased for the second year in a row, from a low of 3,200 acres in 2010, to the 2012 inspected acres of close to 3,900 acres. The 9 year average for this crop is just over 4,700 acres annually.
- Brome grass seed acres, for certification, continue to fall. Compared to the 9 year average inspected acres number ( just under 10,000 acres), 2012 inspected acres of 5,100 is still only 52% of this 9 year average.
| - Timothy seed, a high demand crop around the world and used in many mixtures as well as solid seeding, saw its’ certified seed production acres comparable to its’ 9 year average. 2012 saw 33,000 acres applied for inspection. Production the previous two years had fallen to the 26,000 acres mark. | 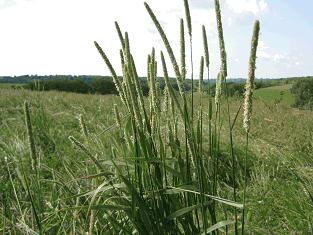 |
Table 1: Certified Canadian Grass & Legume Seed Acres, by Crop (2005 to 2012)
Inspected Acres of Canadian Grass and Legume Seed Crops, by Species |
| Alfalfa | Birds-foot Trefoil | Brome Grass | Clover | Fescue | Ryegrass | Timothy | Wheatgrass |
2005 | 60,853.1 | 2,858.7 | 13,571.6 | 5,460.8 | 29.226.9 | 28,776.0 | 33,722.7 | 10,632.9 |
2006 | 58,401.9 | 3,784.3 | 10,855.2 | 6,378.8 | 22,759.9 | 41,023.9 | 34,295.6 | 7,773.8 |
2007 | 62,871.8 | 5,248.3 | 12,794.7 | 5,342.5 | 20,284.4 | 30,180.8 | 37,438.7 | 9,029.0 |
2008 | 57,056.8 | 5,707.3 | 12,352.6 | 4,185.5 | 23,130.8 | 25,083.6 | 38,403.2 | 8,643.7 |
2009 | 49,158.8 | 4,205.7 | 10,075.4 | 4,123.3 | 17,825.7 | 19,456.0 | 33,581.5 | 6,808.4 |
2010 | 50,866.3 | 4,143.0 | 7,693.5 | 3,195.5 | 14,453.3 | 30,112.4 | 26,454.0 | 7,596.3 |
2011 | 44,116.3 | 5,010.0 | 6,434.0 | 3,600.4 | 10,422.3 | 24,074.1 | 26,024.6 | 6,319.1 |
2012 | 47,456.0 | 7,315.0 | 5,138.0 | 3,886.0 | 10,875.0 | 18,469.0 | 33,012.0 | 5,290.0 |
| Note: with Canada's "Freedom of Information Act" (FOIP), crop types are no longer available at more detailed species levels |
Prepared by David Wong, Market Specialist, Ag-Info Centre, Alberta Agriculture and Rural Development 310-3276
|
|