| | Optimal (target) crop densities | Seed germination and mortality | Calculating seeding rate to achieve target plant density | Seed drill calibration | Shattering and combine losses
The 1,000 kernel (1,000 K) weight is a measure of seed size. It is the weight in grams of 1,000 seeds. Seed size and the 1,000 K weight can vary from one crop to another, between varieties of the same crop and even from year to year or from field to field of the same variety. Because of this variation in seed size, the number of seeds and, consequently, the number of plants in a pound or a bushel of seed is also highly variable.
By using the 1,000 K weight, a producer can account for seed size variations when calculating seeding rates, calibrating seed drills and estimating shattering and combine losses.
Optimal (Target) Crop Densities
Optimal plant densities for crops depend on the crop type, the intended end use for the crop, the region and the growing conditions. Cereals intended for silage, greenfeed or grazing often use higher target densities than grain crops. Similarly, cereals grown as cover crops with forages are seeded at lower plant densities than what is used normally for grain production.
Target plant densities are generally lower in areas of limited rainfall than in areas with plentiful growing season moisture. Higher plant densities can increase crop competitiveness with weeds or can advance maturity by a few days in short season zones. High plant populations, however, can slightly reduce seed size and affect the quality of some crops such as malt barley.
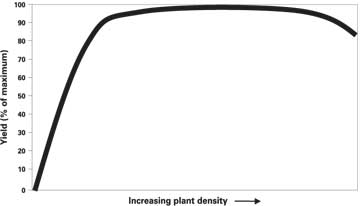
Figure 1. The crop yield and plant density relationship normally follows a pattern
After an initial rapid increase in yield with increasing plant density, there is a plateau of maximum yield over a broad range of plant densities. At very high densities, the yield then declines.
The yield plateau occurs because most crop plants are able to compensate for lower plant densities by increasing branches or tillers, heads or flowers and kernel size. An optimal plant density would be located in the initial part of the plateau, but the exact target would depend on the price of seed and risks.
The target plant densities listed in Tables 1 to 3 are based on trials over many years by different researchers.
Seed Germination and Mortality
To properly calculate the seeding rates needed to achieve target densities, germination tests and 1,000 K weights should be done on all seed lots. An estimate is also needed of seedling mortality to account for seed that germinates but fails to develop into viable plants.
There are many reasons for seedling mortality including disease, insects, excessive fertilizer in the seedrow, improper seeding depth, frost and drought. Unfortunately, seedling mortality can vary greatly from year to year, and field to field.
Mortality in cereals typically ranges from 5 to 20 per cent whereas canola mortality often ranges from 30 to 60 per cent. Since mortality depends on the combination of conditions and practices of individual farms, producers should keep records of emergence (and thus mortality) on their fields.
Calculating Seeding Rate to Achieve Target Plant Density
After a desired target density is chosen, use the actual 1,000 K weight and germination of the seedlot to calculate seeding rates using Equation 1 or 2 below or the seeding rate calculators on Alberta Agriculture’s website.
Steps:
- Choose a desired plant population range from Table 1, Table 2 or Table 3.
- Count out 1,000 seeds and weigh them (grams).
- Estimate a seedling survival rate, which is the germination percentage minus a small amount for seedling mortality (usually 5 to 20 per cent). A common range for estimated cereal seedling survival is 80 to 90 per cent, calculated by subtracting 5 to 10 per cent mortality from 90 to 95 per cent germination.
- Calculate seeding rate in lb/ac or kg/ha for upper and lower limits of target plant density range. The seed drill will then need to be calibrated to fall within this range.
Equation 1 seeding rate (lb/ac) = desired plant population/ft² x 1,000 K wt. (g) ÷ seedling survival rate (in decimal form such as 0.90) ÷ 10.4
Example:
Wheat seeding rate (low end target) =
16 plants/ft² x 35 g ÷ 0.90 ÷ 10.4 = 60 lb/acre
(high end target)= 30 x 35 ÷ 0.90 ÷ 10.4 = 112 lb/acre
Metric formula
Equation 2 seeding rate (kg/ha) =
desired plant population/m² x 1,000 K wt. (g) ÷ seedling survival rate (in decimal form) ÷ 100
Table 1. Cereal seeding rate
 | Desired plant population | | |
| per square meter | per square foot (range) | 1,000 kernel weight (grams) | seeds per pound (average) |
| Wheat |
| Hard red | 250 | 24 (16 - 30) | 31 - 38 | 12,000 - 14,600 |
| CPS | 250 | 24 (18 - 30) | 39 - 50 | 10,800 - 12,000 |
| Durum | 210 | 20 (16 - 24) | 41 - 45 | 10,000 - 11,000 |
| Extra strong | 210 | 22 (20 - 24) | 40 - 44 | 10,000 - 11,000 |
| Soft white | 210 | 20 (18 - 25) | 34 - 36 | 12,600 - 14,200 |
| Barley 2 row | 210 | 22 (16 - 30) | 40 - 50 | 9,000 -11,000 |
| Barley 6 row | 210 | 22 (16 - 30) | 30 -45 | 10,000 -15,000 |
| Oats | 250 | 24 (16 - 30) | 30 - 45 | 10,000 -15,000 |
| Fall rye | 250 | 24 (16 - 25) | 30 - 35 | 13,000 - 15,000 |
| Triticale |
| Spring | 310 | 30 (25 - 35) | 42 - 48 | 9,500 - 10,800 |
| Winter | 250 | 24 (18 - 30) | 43 - 46 | 9,900 - 10,600 |
| Corn |
| Sweet | 5 | 0.5 | 380 | 1,200 |
| Grain | 6.1 | 0.6 | 380 | 1,200 |
| Silage | 7.6 | 0.7 | 380 | 1,200 |
Table 2. Oilseed seeding rate
| Desired plant population | | |
| per square meter | per square foot (range) | 1,000 kernel weight (grams) | seeds per pound |
| Canola |
| Polish | 70 - 170 | 7 - 17 | 2 - 3 | 151,000 - 227,000 |
| Argentine | 40 - 60* | 4 - 6* | 2.5 - 4 OP | 113,500 - 182,000 |
3 - 4.5 SYN | 91,000 - 151,000 |
3.5 - 5.5 HYB | 83,000 - 130,000 |
| Flax | 300 - 400 | 30 - 40 | 5 – 6.5 | 70,000 - 91,000 |
*Newer canola varieties and research have shown lower plant populations can still produce very acceptable yields. However, the "plant population" in this table does not take into account other possible risks to the plant population such as flea beetle depredations, timing of fungicides, swathing, maturity or green seed risk.
Table 3. Special crop seeding rate
| Desired plant population | | |
| per square meter | per square foot (range) | 1,000 kernel weight (grams) | seeds per pound |
| Pea | 75 | 7 (7 - 9) | 125 -300 | 1,500 - 3,600 |
| Bean | 25 | 2.4 (2.2 - 2.6) | 200 - 350 | 1,300 -2,300 |
| Fababean | 45 | 4.3 (4.0 -4.3) | 350 - 425 | 1,000 - 1,300 |
| Lentil | 105 - 147 | 12 (10 - 14) | 30 - 80 | 5,600 -15,000 |
| Buckwheat | 150 | 14 | 30 | 15,100 |
| Safflower | 30 - 60 | 3 - 6 | 36 | 12,600 |
| Sunflower |
| Confection | 4.5 | 0.4 | 175 | 2,600 |
| Oil | 6 | 0.6 | 126 | 3,600 |
Forage grasses and legumes
In forages, the bulk seeding rate refers to the final weight of seed applied to the land. The bulk seeding rate should be based on a desired seeding density or the number of seeds placed in a meter of row or in a square meter. For good stand establishment, seeding densities should be based on pure live seed (PLS).
Tables 4 and 5 provide the PLS seeding densities for individual grass and legume species. Select from the lower PLS range for drier soil zones and the higher PLS range for higher moisture areas. For example, with meadow bromegrass, a seeding density of 40 PLS/meter of row is appropriate for the Brown soil zone while 70 PLS/meter of row would be suitable for the Black soil zone.
Seeding rates for 15, 23 and 30 cm rows are listed in Tables 4 and 5. These seeding rates are based on the average seeding density for each species listed in the tables. The final bulk seeding rate will reflect other factors such as seed quality and amendments such as seed coatings. The seeding system, broadcast or row seeding, may also influence the final quantity of seed required.
Example:
For pure stands, an initial bulk seeding rate can be obtained with the following formula:
Target PLS seeding rate ÷ per cent PLS (seed certificate) = bulk seed requirements
Meadow brome in 23 cm spacing = 13 kg/ha ÷ 75% PLS = 17.3 kg/ha
Table 4: Forage grass species seeding rate
| Seeding density for pure stands | 1,000 kernel weight | Seeds per pound | Seeding rate PLS kg/ha row spacing
in cm |
| PLS/meter of row | PLS/m2 | (grams) | (average) | 15 | 23 | 30 |
| Bromegrass |
| Meadow | 40 - 70 | 175 - 350 | 5.22 | 86,860 | 19 | 13 | 10 |
| Smooth | 40 - 70 | 175 - 350 | 3.17 | 142,855 | 12 | 8 | 6 |
| Foxtail | | | | | | | |
| Creeping | 150 - 200 | 600 - 900 | 0.58 | 785,930 | 7 | 4 | 3 |
| Meadow | 130 - 150 | 600 - 950 | 1.11 | 406,810 | 10 | 7 | 5 |
| Fescue |
| Creeping red | 90 - 120 | 400 - 550 | 1.20 | 374,800 | 8 | 7 | 4 |
| Meadow | 70 - 100 | 300 - 450 | 1.97 | 230,000 | 11 | 7 | 6 |
| Tall | 70 - 100 | 300 - 450 | 2.20 | 205,685 | 12 | 8 | 6 |
| Kentucky bluegrass | 250 - 300 | 950 - 1300 | 0.20 | 2,176,628 | 4 | 3 | 2 |
| Orchardgrass | 180 - 200 | 700 - 900 | 1.06 | 427,127 | 13 | 9 | 7 |
| Reed canarygrass | 180 - 200 | 700 - 800 | 0.84 | 537,828 | 10 | 7 | 5 |
| Timothy | 150 - 225 | 650 - 1000 | 0.39 | 1,163,000 | 5 | 3 | 2 |
| Wheatgrass |
| Crested (diploid) | 30 - 60 | 130 - 260 | 1.46 | 311,147 | 4 | 3 | 2 |
| Crested (tretraploid) | 30 - 60 | 130 - 260 | 5.15 | 194,087 | 7 | 5 | 4 |
| Intermediate | 30 - 60 | 130 - 260 | 5.66 | 80,066 | 17 | 11 | 9 |
| Northern | 30 - 60 | 130 - 260 | 3.12 | 144,975 | 9 | 6 | 5 |
| Pubescent | 40 - 60 | 175 - 260 | 5.66 | 80,066 | 17 | 11 | 9 |
| Slender | 30 - 60 | 130 - 260 | 3.35 | 134,977 | 10 | 7 | 5 |
| Tall | 40 - 60 | 175 - 260 | 6.02 | 75,307 | 20 | 13 | 10 |
| Western | 30 - 60 | 130 - 260 | 3.94 | 114,980 | 12 | 8 | 6 |
| Hybrid grass |
| Hybrid brome | 40 - 70 | 175 - 350 | 4.99 | 90,821 | 18 | 12 | 9 |
| Hybrid wheatgrass | 30 - 60 | 130 - 260 | 3.84 | 117,980 | 12 | 8 | 6 |
Table 5. Forage legume species seeding rate
| Seeding density for pure stands | 1,000kernel weight | Seeds per pound | Seeding rate PLS kg/ha row spacing in cm |
| PLS/meter of row | PLS/m2 | (grams) | (average) | 15 | 23 | 30 |
| Alfalfa | 40 -120 | 175 - 550 | 2.00 | 226,760 | 11 | 7 | 5 |
| Birdsfoot trefoil | 100 -150 | 450 - 650 | 1.23 | 369,777 | 10 | 7 | 5 |
| Cicer milkvetch | 70 - 90 | 300 - 400 | 3.70 | 122,539 | 19 | 13 | 9 |
| Clover |
| Alsike | 160 | 750 | 0.67 | 680,283 | 7 | 5 | 4 |
| Red | 110 -130 | 450 - 550 | 1.67 | 272,108 | 13 | 9 | 7 |
| Sweet | 80 - 120 | 350 - 550 | 1.75 | 258,516 | 12 | 8 | 6 |
| White | 160 | 750 | 0.58 | 775,867 | 6 | 4 | 3 |
| Sainfoin | 40 - 60 | 175 - 250 | 19.96 | 22,716 | 65 | 43 | 33 |
To convert PLS/meter to PLS/ft of row, divide by 3.28; to convert PLS/M2 to PLS/ft2 , divide by 10.80.
To evaluate seeding success, new seedings should be inspected in the year of seeding and the following spring to confirm stand density. Table 6 provides an estimate for forage seedling densities for first-year stands.
Table 6.
| Suggested seedling density (plants/m2 ) |
| Soil zones | Legumes | Grass/legume(50:50) | Grass |
| Black | 80 -100 | 80 -100 | 100 -160 |
| Dark Brown | 60 - 100 | 60 - 100 | 100 -160 |
| Brown | 30 - 50 | 20 - 40 | 20 - 40 |
| Grey Wooded | 40 - 50 | 30 - 40 | 40 - 50 |
| Irrigation | 150 - 250 | 150 - 200 | 200 - 300 |
| To convert plants/m2 to plants/ft2, divide by 10.80 |
Source: Alberta Agriculture and Food forage staff, AFSC Crop Insurance
Further information on forage establishment can be obtained from the factsheet Perennial Forage Establishment in Alberta, Agdex 120/22-3. Assistance in developing forage seed mixtures can be obtained through the use of the Forage Seed Mixture Calculator found in the “calculators” section of Alberta Agriculture and Forestry website.
Seed Drill Calibration
Once the desired seeding rate is calculated, the next step is to calibrate the seed drill so that it drops the right amount of seed. The following formula tells you how many grams of seed should be collected from one drill run after driving a distance of 100 feet. To make this measurement easier, stake out the distance or count the number of turns of the front tractor tire makes over the required distance.
Formula:
Seed weight per 100 feet of row (grams) = seeding rate (pounds per acre) x row spacing (inches) ÷ 11.5
Metric formula:
Grams of seed per 100 m of row = seeding rate (kg/ha) x row spacing (cm) ÷ 10
Shattering and Combine Losses
The following tables can be used to calculate yield losses of five crops with a range of 1,000 K weights.
| Average number of seeds per square foot to equal a 1 bushel per acre loss |
| (g) | Wheat | Oats | Barley |
| 1,000 K weight of crop (grams) | 25 | 24 | 13.6 | |
30 | 20 | 11.3 | 16 |
35 | 17.1 | 9.7 | 13.7 |
40 | 15 | 8.5 | 12 |
45 | 13.3 | 7.6 | 10.7 |
50 | 12 | | |
.
| Average number of seeds per square foot to equal a 1 bushel per acre loss |
| (g) | Canola | | (g) | Peas |
| 1,000 K weight of crop (grams) | 2 | 261 | 1,000 K weight of crop (grams) | 125 | 5 |
2.5 | 208 | 150 | 4.2 |
3 | 174 | 175 | 3.6 |
3.5 | 149 | 200 | 3.2 |
4 | 130 | 225 | 2.8 |
4.5 | 116 | 250 | 2.5 |
5 | 104 | 275 | 2.3 |
A range of seeding rate calculators can be accessed through the Alberta Agriculture and Forestry website. Look under “calculators” and then “seeding.”
- barley
- wheat
- oats
- triticale
- fall rye
- winter wheat
- winter triticale
- peas, pulses
- forages
For more information, call the Alberta Ag-Info Centre at 310-FARM (3276)
Prepared by
Alberta Agriculture and Forestry
Source: Agdex 100/22-1. Revised May 2018. |
|