| | Background | Application rates | Feed/flow rate and distribution uniformity | Work rate | Calibration | Adjusted travel speed (ATS) calculation | Main and fine tune adjustment calculations
Manure, a natural by-product of livestock opera�tions, can be either an asset or liability. If applied to soil at proper rates, manure is an asset. Manure can en�hance soil tilth by improving structure and biological activity, increasing aeration, organic material and water-holding capacity and reducing soil erosion. The improper application of manure can cause problems.
Background
Livestock manure is also an organic fertilizer that is beneficial to soil and crops by provid�ing macro nutrients such as nitrogen, phosphorus, and potassium along with various micro nutrients. Manure can be beneficial for light textured and/or degraded soils low in organic material.
Crops are affected by excess or insufficient nutri�ent levels in the soil; therefore, both high or low ma�nure application rates can affect yield.
Environmental pollution is also a concern with improper manure application rates. Some environmental concerns regarding excess manure application are potential run-off contaminating ground and surface water, air pollution, soil and water nutrient overload�ing and agronomic damage of plants and soil microbiology.
Calculating the application rate and having confidence in the manure applicator are very important. Calibrating an applicator properly to apply manure is a simple and effective process that will assist in minimizing potential environmental damage, maximize the potential of manure nutrients use and maximize soil improvement and crop health.
Application Rates
The proper manure application rate depends on the manure and soil properties. Specifically, manure type, density, moisture con�tent, nutrient content and applicator style determine the application rate. Soil properties include soil classification, nutrient content, crop and landscape and are the second part to determining application rate.
A manure and soil analysis should be completed before a manure application is performed.
Manure application rates should generally be lower in areas with light soil types, low-lying areas, near water bodies and on slop�ing land compared to areas with flat elevations and heavier soil types.
Annual precipitation rates should also be taken into ac�count when applying manure. High precipitation may increase runoff; however, low precipitation may result in topsoil nutrient overloading.
Dry, compact soils will also have increased runoff. The guidelines and regulations for manure application listed in the provincial Agricultural Opera�tions Practices Act (AOPA) should be followed.
Manure that has been composted will require a lower applica�tion rate than a fresh manure due to the higher concentration of nutrients per dry volume. Different animals, feeds and different beddings used will also affect the manure structure and nutrient concentrations per volume, requiring variable application rates.
Feed/flow Rate and Distribution Uniformity
Manure type, density and content all have an effect on the appli�cator feed/flow rate and distribution uniformity. The applicator design also has an effect on the manure feed/flow rate.
Different manure types can vary in density and moisture content. Dry manure, such as compost, will be light, less dense, porous and free of lumps and will, therefore, spread more evenly, quickly and easily than moist manure through most spreaders. Moist manure will be heavier, less porous, more dense and lumpy from sticking together and therefore will not spread as evenly or as quickly as dry manure.
All manures will have varying densities due to the content and amount of bedding used, animal and feed type and moisture content. All of these elements account for the makeup of the manure and will affect the feed/flow rate and distribution uniformity when being applied.
There are several designs of manure applicators: horizontal or vertical beater type and rear or side discharge. The manure feed into the discharge can be a feed bar and chain or a hydraulic or chain drive push gate. The bed can be wood or poly-covered. The discharge can be a single beater or several beaters and/or rotors. The dischargers can vary in design and size and by range of operating speeds. All these features will affect the manure feed/flow rate and distribution uniformity.
Work Rate
Before the work rate is calibrated, the required application rate must be determined based on the soil and manure analysis and the crop requirements or based on soil nutrient limitations.
The work rate of the applicator depends on all the parameters listed under feed/flow rate. However, the applicator size, tractor size and travel speed are also factors in determining the work rate. The work rate will vary by the flow rate of the manure into the discharge, the discharge speed and the applicator discharge design and delivery aggressiveness.
The applicator should be calibrated each time a different source of manure is used. Once the new feed/flow rate is determined, the work rate can be calculated.
The work rate can be adjusted by one or all of the following:
- engine rpm and PTO (power-take-off) speed
- ground travel speed
- hydraulic flow control
- applicator mechanical design and settings
Overall, it is very important to set the applicator adjustments for their best potential to ensure the most even distribution of manure product across the entire width of spread.
Calibration
To calibrate a solid manure applicator, determine the following in this order:
- The amount of manure put on a known area or the area the applicator covers to be emptied. If using the known capacity calibration method of the applicator, the holding volume of the applicator is required.
- The effective manure spreading width (EMSW) of the applicator, which will determine the spacing required for each pass of the applicator.
- An adjusted application rate after the EMSW is deter�mined.
- The required applicator settings or travel speed to achieve the desired application rate.
The EMSW accounts for the manure distribution spread unifor�mity and determines the amount of overlap (applicator spacing) required for each application pass.
There are two solid manure applicator calibration methods:
Method 1: Calibration procedure for unknown capacity of applicator
Method 2: Calibration procedure for known capacity of applicator
Method 1: calibration procedure for unknown capacity of applicator
The following items are required for the calibration process:
- 5 tarps of the same dimension – this is the minimum num�ber recommended, but as many equal-sized tarps as neces�sary or that are available to catch the spread width of all applied manure should be used – the more tarps used, the more accurate the calibration will be
- same number of buckets as tarps
- 2 flags
- weigh scale with a maximum capacity from 25 to 50 kg (55 - 110 lbs)
- measuring tape
- conversions:
- 10,000 m� = 1 hectare (2.47 acres) or 43,560 ft� = 1 ac (0.4 ha)
- 1 tonne (t) = 1,000 kg (2,204 lbs) or 1 long ton (ton) = 2,240 lbs (1,016 kg)
- 1 kg = 2.204 lbs
- 1 m� = 10.76 ft�
First, the manure spread width (MSW) needs to be measured to deter�mine how wide a catch area the collection tarps need to cover. Load the applicator with manure and apply on the ground using a pre-determined engine speed, applicator set-up and travel speed. Next, measure the average total spread width of manure applied by the applicator (MSW). Now, determine the number of equal-sized tarps required to collect the entire width of applied manure.
Calibration process for application rate (AR) intonnes/hectare (ton/acre):
- Place the tarps required based on the manure spread width, side by side in a line perpendicular to the direction of travel on flat ground. Overlap the tarps by 2.5 cm (1 inch) (see Figure 1).
- Calculate each tarp area (TA) covered (see Instruction 1 next page).
- Place a flag at each end at the center of all the combined tarps.
- Drive the applicator across the tarps, in line with the flags, at the pre-determined operating settings while ap�plying manure. Ensure the applicator is operating at full and normal capacity at the point of passing over the tarps, so a representative sample is applied to measure.
- Weigh each empty bucket and record the weight.
- Empty the manure from each tarp into individual buckets and weigh again. Record the weights.
- Calculate the net weight and weight per unit area of the manure for each tarp. From these calculations, the AR can be determined. Refer to Instruction 2.
- Now, apply these calculated figures to Chart 1 as shown in Example 2 and explained in Instruction 3.
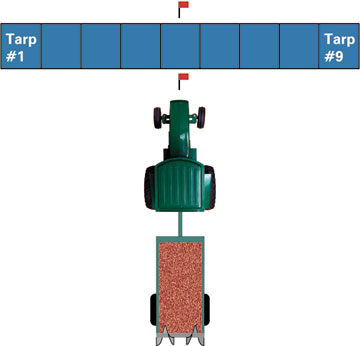
Figure 1. Tarp layout
Instruction 1: calculating tarp area (TA) covered
Measure the width and length of tarp, and multiply the two measurements to calculate the tarp area.
Example 1
| Width = 1.5 m (4.9 ft) |
| Length = 3.7 m (12 ft) |
| Area | = | width x length |
 | = | 1.5 m x 3.7 m (4.9 ft x 12 ft) |
| = | 5.5 m� (58.8 ft�) |
| Total area | = | area x number of tarps |
| | = | 0.00055 ha x 9 | = 0.005 ha |
| ( | = | 0.0013 ac x 9 | = 0.012 ac) |
Instruction 2: calculating net weight, weight per area and AR
Subtract the empty bucket weight from the full weight to determine the tarp area manure net weight. Do this for each tarp that manure was applied to (see Table 1 example).
Example 2 – using Good Pattern #1 from Figure 2
| Bucket #1 empty weight | = | 2 kg (4.4 lbs) |
| Bucket #1 manure full weight | = | 8.6 kg (18.9 lbs) |
| Tarp area manure net weight | = | full weight - empty weight |
| = | 8.6 kg - 2 kg (= 18.9 lb - 4.4 lb) |
| = | 6.6 kg (= 14.5 lb) |
| Manure weight/area | = | manure weight � single tarp area |
| = | 6.6 kg � 5.5 m� (= 14.5 lb � 58.8 ft�) |
| = | 1.2 kg/m� (= 0.2 lb/ft�) |
Table 1. Example “Good Pattern #1” manure spread pattern as shown on Chart 1
| Manure weight
per tarp | Manure weight
per area | Distance from
applicator |
| Bucket # | kg | (lb) | kg/m2 | (lb/ft2) | m | ft |
1 | 6.6 | 15.0 | 1.2 | 0.20 | -6.0 | -19.6 |
2 | 12.6 | 28.8 | 2.3 | 0.5 | -4.5 | -14.7 |
3 | 18.7 | 41.0 | 3.4 | 0.70 | -3.0 | -9.8 |
4 | 19.2 | 42.0 | 3.5 | 0.71 | -1.5 | -4.9 |
5 | 19.8 | 44.0 | 3.6 | 0.74 | 0 | 0 |
6 | 19.2 | 42.0 | 3.5 | 0.71 | 1.5 | 4.9 |
7 | 18.7 | 41.0 | 3.4 | 0.70 | 3.0 | 9.8 |
8 | 12.6 | 28.0 | 2.3 | 0.50 | 4.5 | 14.7 |
9 | 6.6 | 15.0 | 1.2 | 0.20 | 6.0 | 19.6 |
Now, plot the manure weight/tarp versus distance from applica�tor (refer to Table 1 example) on the Chart 1 (Figure 2 – Good pattern #1).
| Total Manure Weight | = | Sum of manure weight from each bucket |
| = | 6.6+12.6+18.7+19.2+19.8 + 19.2 + 18.7 + 12.6 + 6.6 |
| = | 134 kg (295 lb) |
| Conversions to tonnes | = | 134 kg � 1,000 kg/tonne = 0.134 t |
(to tons | = | 295 lb � 2,240 lb/ton = 0.13 ton) |
| Application Rate (AR) | = | 0.134 t / .005 ha (total tarp area)= 26.8 t/ha |
| = | (0.18 ton/0.012 ac = 10.8 ton/ac |
Chart 1 pattern explanations
The manure spread distance is on the x-axis in Figure 2, and the manure sam�ple weights/unit area are on the y-axis. In this calibration proce�dure, nine tarps were used to collect manure samples for increased accuracy. The chart shows six different random spread patterns of manure.
Three spread patterns are common and desirable (labeled Good Pattern), which are the best patterns to ensure an accurate EMSW calcula�tion and even application rate. Three patterns are non-uniform spreads (labeled Poor Pattern) likely encountered with older, damaged or improperly adjusted applicators and are very difficult to determine an EMSW. The poor patterns do not have pre�dictable trend lines, have uneven application rates on each tarp measured, and some indicate that the width of spread is further to one side of the applicator or applies more manure on one side than the other.
A typical spread pattern of a properly adjusted, older rear beater type applicator is indicated by Good Pattern #3. Notice on Good Pattern #3 that the highest amount of manure was spread directly behind the applicator and the manure amount gradually declined the further it was discharged to either side of the applicator.
Good Pattern #1 and 2, likely encountered with newer or side discharge manure applicators, are more uniform across the width of spread but also indicate that as the manure is spread further out, the weight tapers off near the outside of the spread. This pattern is a normal occurrence and is also the reason why an EMSW should be calculated for all applicators.
No method of calibration or EMSW will be perfect due to the variability of every situation, but performing the calibration pro�cedures can reduce application errors from as high as 100 per cent down to as low as 10 per cent. Applicators that cannot apply manure evenly across the majority of the spread width, no matter how precisely adjusted, are not recommended for manure application.
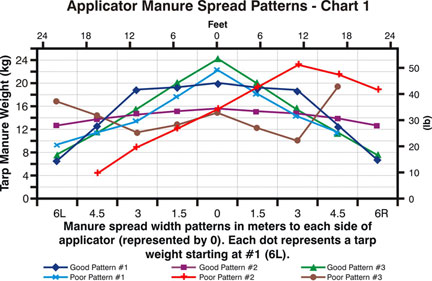
Figure 2. Good and poor manure applicator spread patterns Chart 1
Instruction 3: calculating the EMSW
EMSW Calculation for spread patterns similar to Good #1, 2 and 3 from Figure 3. Patterns #1 and 3 have the majority of the manure located near the center of the spread and the pattern tapers off at the outside of the spread. These two patterns will have less overlap per pass than patterns such as #2, which has a close to even spread of manure across the entire width with a slightly declining taper from the applicator to the outsides of the spread. For all types of spread patterns, the same EMSW calculation is used as follows:
Record the total weight of manure spread on all the tarps and divide the number by the number of tarps used (which is the average weight). Now, locate the average number on the y-axis (weight) of the chart and draw a line across (this is the dissection line – see Figure 3).
Look across the chart to where the spread pattern graph line intersects the dissection line (see Figure 3) on the outer tarp sections. Record the distance number in meters on the X-axis at the two points where the spread pattern intersects with the dissection line and add both numbers together. Then, divide this number by 2 and this is the Effective Manure Spread Width of the applicator (see Example 3).
Example 3 – EMSW calculation using GoodPattern #1
| Total applied manure weight | = | 134 kg (295 lbs) |
| 134 � 9 (number of tarps) | = | 14.9 kg (295 � 9 = 33 lbs) |
| 14.9 is the Good Pattern #1 dissection line and intersects the spread pattern line on tarp #2 at approximately 4.0 m (13 ft) and at 4.0 m (13 ft) on tarp #8 |
4.0 + 4.0 = 8.0 � 2 = 4.0 m (13 + 13 � 2= 13 ft)
|
The EMSW is 4.0 m (13 ft), and this is the distance (spacing) that every pass of the applicator should be apart to apply the most uniform amount of manure.
EMSW calculation using Good Pattern #2
| Total applied manure weight | = | 127.8 kg (282 lbs) |
| 127.8 � 9 (number of tarps) | = | 14.2 kg (282 � 9 = 31 lbs) |
| 14.2 is the Good Pattern #2 dissection line and intersects the spread pattern line on tarp #3 at approximately 3.5 m (11 ft) and at 3.5 m (11 ft) on tarp #7 |
3.5 + 3.5 = 7.0 � 2 = 3.5 m (11+ 11 � 2 = 11 ft)
|
The EMSW is 3.5 m (11 ft), and this is the distance (spacing) that every pass of the applicator should be apart to apply the most uniform amount of manure.
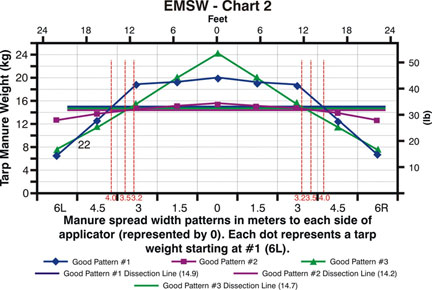
Figure 3. Effective Manure Spread Width Chart 2
The Good Pattern #3 dissection line is 14.7, and therefore, the EMSW is 3.2 m (10 ft), and this is the distance (spacing) that every pass of the applicator should be apart to apply the most uniform amount of manure.
*Note: One must remember that the EMSW applicator spacing for most spread patterns is allowing for multiple overlaps of manure to accomplish the most accurate application rate across the entire width. Due to the manure application overlaps, the measured and calculated application rate from each tarp will need to be adjusted, and this new value is the adjusted application rate (AAR) calculated as follows:
Adjusted Application Rate – First, determine the maximum manure spread width per pass. Next, divide the maximum spread width by the EMSW number calculated above. This new value is the number of passes of overlap. Multiply the overlap passes number by the application rate per pass and this new value is the AAR (see Example 4).
Example 4 – The AAR for Good Pattern #1 from the EMSW Chart 2 in Figure 3
The AR is 26.8 t per ha (10.8 ton per ac)
The maximum manure spread width per pass is 12 m (39 ft)
The EMSW is 4.0 m (13 ft) |
| 12 � 4.0 = 3.0 | (39 � 13 = 3.0) |
| 3.0 x 26.8 = 80.4 | (3.0 x 10.8 = 32.4) |
| Therefore the Adjusted Application Rate (AAR) after the EMSW calculation is 80.4 t per ha (32.4 ton per ac) |
Now the required application rate will need to be set by the travel speed and available machinery adjustments determined by the following procedures of Adjusted Travel Speed (ATS), Main Adjustment Application Rate(MAAR) and Fine Tune Application Rate Speed (FTARS).
Adjusted Travel Speed (ATS) Calculation
From the initial calibration process, the required applicator speed to apply the required application rate can easily be calculated as follows:
First, determine the travel speed over the tarps, and calculate the application rate from the initial calibration procedure (if a speedometer is not available on the applicator, refer to Speed Calculation below). Now, enter the initial AAR, and divide by the required application rate. This is the factor to multiply the initial travel speed by to determine the required new Adjusted Travel Speed (ATS) for the required rate (see Example 5).
Example 5 – ATS calculation
Travel speed = 4.8 km/h (3 mph) | | |
Initial Adjusted Application Rate
from Example 4 | = | 80.4 t/ha (32.4 ton/ac) |
Required application rate | = | 30 t/ha (11.9 ton/ac) |
80.4 t/ha � 30 t/ha = 2.7 (factor) x 4.8 km/h = 12.9
..(32.4 ton/ac � 11.9 ton/ac = 2.7 x 3 mph = 8.1)
|
| The Adjusted Travel Speed for the required rate is 12.9 km/h (8.1 mph) |
Speed Calculation: Using a timing device (such as a stopwatch), record the time in seconds that it takes to drive a measured distance while using a constant engine speed and gear. Then, divide the measured distance by the seconds it took to complete the distance. Multiply this number by 60 (number of seconds in a minute). Now, multiply this number by 60 again (number of minutes/hour), and this total gives the distance that would be traveled in one hour. Finally, divide the distance traveled per hour by 1,000 (m/km) or by 5,280 (ft/mile), and this is the travel speed in km/h (mph) (see Example 6).
Example 6 – it took 30 seconds (s) to travel 50 meters (m) (164 ft) with applicator
50 m (164 ft) � 30 s | = | 1.67 m /s (5.5 ft/s) |
1.67 m/s x 60 s/min | = | 100 m/min (328 ft/min) |
100 m/min x 60 min/hr | = | 6,000 m/hr (19,680 ft/hr) |
6,000 m/hr � 1,000 m/km | = | 6 km/hr (19,680 ft/hr� 5,280ft/mile = 3.7 mph) |
Main and Fine Tune Adjustment Calculations
Most applicators have one or more main adjustment settings to change the application rate. To determine the application rate with an adjustment lever, two calibration processes will need to be performed. One with the applicator set at one adjustment lever position and then another calibration with a different ad�justment position.
To determine the required adjustment setting for the desired application rate, follow this calculation procedure and/or Example 7:
Determine the application rates (see Instruction 2 onpage 4) for any two common ad�justment settings. Now, calculate the difference between application rates at each setting. If the second calibration was completed by changing the adjustment by one posi�tion, then the rate difference between each adjustment is how much rate that needs to be added or subtracted with each adjustment position change, up or down, assuming the rate change is linear.
If the adjustment lever was changed by more than one position from the initial calibration position, then the difference between the two calibration rates needs to be divided by the number of adjustment position changes. The divided number is the rate to add or subtract from the initial calibration rate for each adjustment position change, up or down, and this is the Main Adjustment Application Rate (MAAR) calibration.
Example 7 – initial calibration set up scenario for MAAR
Feed-bed speed has 5 adjustment position settings. The ap�plicator was operated at 4.8 km/h (3 mph) with the feed-bed set at position #4, and the calibration rate was80.9 t/ha (32.3 ton/ac). A second calibration was completed at the same speed with a #3 feed-bed position setting, and the calibration rate was 59.8 t/ha (23.8 ton/ac).
80.9 t/ha - 59.8 t/ha = 21.1 t/ha (32.3 ton/ac - 23.8 ton/ac = 8.5 ton/ac)
This is the rate change, up or down, per feed-bed adjustment position.
If the second calibration was completed in lever position #2 (2 position changes), then the rate change, up or down, per feed-bed adjustment setting is calculated by:
21.1 t/ha (8.5 ton/ac) � 2 (# of position changes) = 10.5 t/ha (4.2 ton/ac)
Now, if the required application rate is 30 t/ha (11.9 ton/ac) and only 1 lever position change was used, then calculate as follows:
1 adjustment position change increased/decreased the rate by 21.1 t/ha (8.5 ton/ac)
80.9 t/ha - 30 t/ha � 21.1 t/ha (32.3 ton/ac - 11.9 ton/ac � 8.5 ton/ac) = 2.4, which is the number of positions the feed-bed speed needs to be adjusted down from #4 to #1.6
Now, as mentioned earlier, the applicator only has position settings from 1 to 5 and no half adjustments. Therefore, the 1.6 is not available, and so position #2 or #1 will have to be used, and then an additional fine tune adjustment or the travel speed (see ATS calculation and Example 5 on pages 6 and 7) will need to be changed.
For fine tune and final adjustment setting and rate calculations, the same procedure as used for the MAAR (see Example 7) calibration can be completed with each fine tune adjustment to meet the required application rate. If only one main adjustment is available on the unit, travel speed (see ATS calculation) will need to be changed for fine tune adjustments explained below.
First, determine the application rate after the main applicator adjustment has been made (see Example 7). Then, calculate the difference from this application rate and the required application rate, and divide this number by the required application rate to determine the adjustment factor. Multiply the factor by the cali�bration travel speed, and this figure is the Fine Tune Application Rate Speed (FTARS) (see Example 8).
Example 8 – FTARS calibration
80.9 t/ha (32.3 ton/ac) is the initial rate
21.1 t/ha (8.5 ton/ac) is the rate change per feed bed adjustment position. The rate change is therefore 42.2 t/ha
(17 ton/ac) for 2 adjustment positions
30 t/ha (11.9 ton/ac) is the required rate
4.8 km/h (3 mph) is the calibration travel speed
80.9 t/ha – 42.2 t/ha (2 position settings change x 21.1 t ha) = 38.7 t/ha
(32.3 ton/ac – 17 ton/ac = 15.3 ton/ac)
38.7 t/ha � 30 t/ha (required rate) (15.3 ton/ac / 11.9 ton/ac) = 1.29 (factor)
1.29 x 4.8 km/h (3 mph) = 6.2 km/h (3.9 mph), and this is the Fine Tune Application Rate Speed
Method 2: calibration process for known capacity of applicator
The following items are required for the calibration process:
- timing device
- measuring tape
Calibration process, by step, for application rate in tonnes/hectare (ton/acre):
- Load the applicator with manure, and apply on the ground using a pre-determined engine speed, applicator set-up and travel speed. Completely empty the applicator while re�cording the time it takes.
- Measure the average total spread width of manure ap�plied by the applicator.
- Measure the distance travelled to empty the applicator.
- Calculate the weight per area of the total manure applied. From these calculations, the Application Rate can be de�termined. Refer to Instruction 4 and Example 9.
Instruction 4: calculating mass per area and application rate
- record the average manure application total spread width
- record the distance travelled to empty the applicator
- re�cord the time required to empty the applicator
Example 9 – AR for known applicator capacity
Total manure spread width = 14.6 m (50 ft)
Distance travelled = 613.2 m (2,011 ft)
Total area covered = 14.6 m x 613.2 m = 8,953 m�
(50 ft x 2,011 ft = 96,341 ft�)
8,953 m� � 10,000 m� = 0.9 ha
(96,341 ft� � 43,560 ft� = 2.2 ac)
Applicator volume known capacity = 16 t (15.7 ton)
Application rate = 16 t � 0.9 ha = 17.8 t per ha
(15.7 ton � 2.2 ac = 7.1 ton per ac)
Note that the Effective Manure Spread Width is not determined from this calibration method. Therefore, the distance of separation (spacing) between every pass of the applicator will have to be assumed or the EMSW calibration procedure (Instruction 3, page 5) can be performed. The appli�cator should be set to spread the manure evenly across the width of spread to assume the best spacing used for each applicator pass (spacing).
References
Davis, J.G. and R.B. Meyer. Manure Spreader Calibration. Crop Series. Soil. Colorado State University Cooperative Extension. No. 0.561.
Koelsch, R. C. Shapiro, and R. DeLoughery. 2002. Nebraska’s CNMP: Manure Application Workbook. University of Nebraska Cooperative Extension Publication No EC02-720. Lincoln, NE. 90 pages.
Koelsch, R. 1995. Manure Applicator Calibration. NebGuide. Cooperative Extension Institute of Agriculture and Natural Re�sources, University of Nebraska-Lincoln. G95-1267-A.
Dann Bolinger. Michigan Dairy Review Vol. 9 No. 1 January 2004. Making Manure Spreader Calibration Practical and Use�ful. Pg. 4-6.
Prepared by
Blaine Metzger, Lawrence Papworth, Virginia Nelson and Katrina Sexton
AgTech Centre, Alberta Agriculture and Rural Development
More information contact
Alberta Ag-Info Centre. Call toll-free 310-FARM (3276)
Source: Agdex 743-2. September 2010. |
|