| | Description | Data sources | Potential uses | Limitations | Further information | Download spatial information
Description
The data represents the annual solar radiation in Alberta over the 30-year period from 1971 to 2000. A 30-year period is use to describe the present climate since it is enough time to filter out short-term fluctuation by is not dominated by any long-term trend in the climate.
The amount of solar radiation received at the earth's surface varies with two factors that depend on latitude: the angle of the sun's rays and the hours of daylight. The distance from the equator, and therefore the intensity of the sun's radiation has the greatest effect on climate. Canada's position in the northern portion of the earth's northern hemisphere means that it receives less solar radiation compared to countries nearer the equator. The northward decrease in solar radiation is also noticeable within Alberta. Temperatures are generally higher in southern Alberta in comparison to northern Alberta because the south receives more solar radiation.
The annual solar radiation is measured in megajoules per square metre (MJ/m2) and was mapped in the following classes: less than 4200, 4200 to 4400, 4400 to 4600, 4600 to 4800 and greater than 4800.
Data Sources
Solar radiation was estimated using the Hargreaves and Samani (1982, 1985) equation for each township center using interpolated daily maximum and minimum temperature measurements.
This equation estimates solar radiation as a function of the difference between the daily maximum and minimum temperatures with an adjustment coefficient of 0.16. Additionally, it uses Julian day, Latitude and elevation to estimate the suns position relative to the point of interest on the earth’s surface. This methodology as has shown good agreement (r2 = 0.87) with measured daily solar radiation data at several of the ARD’s meteorological stations.
Southern Alberta receives the greatest amount of annual global solar radiation with the amount gradually decreasing as you move farther north. However, cropping is successful in the northern (Peace River) area of Alberta because the longer summer day length helps compensate for the less intense solar radiation. Cloud cover in the mountains will reduce the amount of solar radiation received there.
The amount of solar radiation received at the earth’s surface varies with two factors that depend on latitude: the angle of the sun’s rays and the hours of daylight. The distance from the equator, and therefore the intensity of the sun’s radiation has the greatest effect on climate. Canada’s position in the northern portion of the earth’s northern hemisphere means that it receives less solar radiation compared to countries near the equator. The northward decrease in solar radiation is also noticeable within Alberta. Temperatures are generally higher in southern Alberta in comparison to northern Alberta because the south receives more solar radiation.
The synoptic weather stations, which collect weather data over a broad area at a single given time, collect data. These stations report near real-time (hourly, 6-hourly and daily) automated weather information used to prepare weather forecasts and in calculating climatic information. Few Alberta stations measure solar radiation, therefore, calculation was needed to provide a satisfactory estimate across the province. Weather stations data is by Environment Canada and the United States National Climate Data Center weather stations, over the 30 years period.
Potential Uses
Southern Alberta receives the greatest amount of annual global solar radiation with the amount gradually decreasing as you move farther north. However, cropping is successful in the northern (Peace River) area of Alberta because the longer summer day length helps compensate for the less intense solar radiation. Cloud cover in the mountains will reduce the amount of solar radiation received there.
Producers use climate information, including solar radiation, as a long-term planning tool. For example, in selecting a location for a farm or planning a cropping program, this information is important. Knowing that southern Alberta receives more solar radiation, making temperatures generally higher there, will affect the cropping choices and management options available. By combining knowledge of the agricultural operation with knowledge of what is likely to happen (climate), the producer can then decide on the acceptable level of risk due to adverse conditions.
Limitations
The number of weather stations in Alberta that collect solar radiation data is very limited. This makes the interpolated pattern less reliable than if data was received from more locations in the province. Therefore, solar radiation was estimated for each township of Alberta using the method described above. In order to avoid the blocky appearance of townships on the map, a township generalization was produced using smoothing procedures of computer graphics software for final presentation on the map.
Download Spatial Information
Click on map for larger view
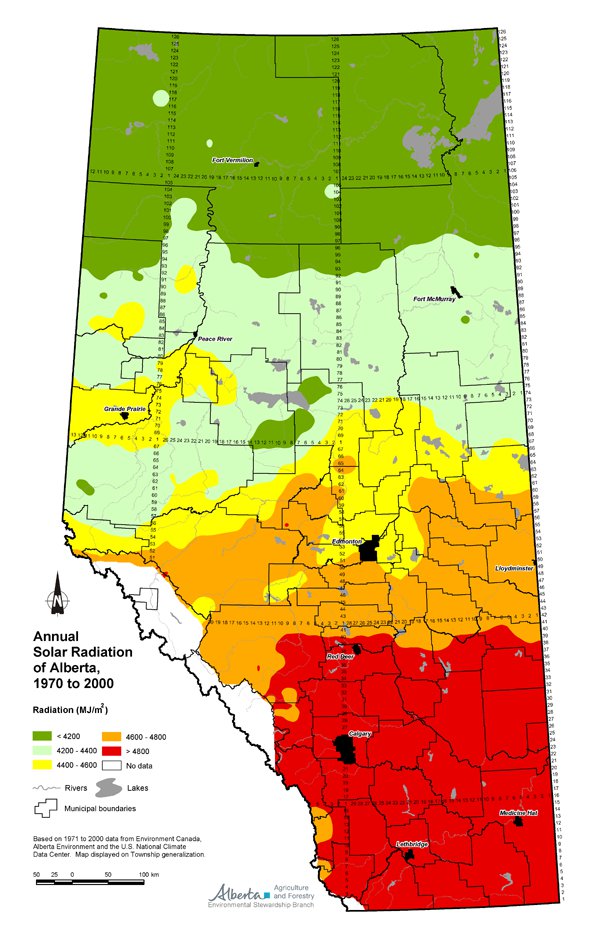
Agricultural Land Resource Atlas of Alberta - Annual Solar Radiation of Alberta, 1971 to 2000
The Map and links below have been superseded by the Map and links above:
|
|