| | Abstract | Introduction | Objectives | Materials and methods | Results and discussion | Summary | Acknowledgements | References
Abstract
Although soil nitrate nitrogen (N) has been used as a basis for N fertilizer recommendation in western Canada, potential mineralizable N should be (or is) a more accurate indicator of the N supplying power of the soil. Potential mineralizable N, analyzed by extraction with hot KCl, and organic matter content were determined on the AESA Soil Quality Benchmark Sites in Alberta. Using these results, we developed an approach to estimate Nt from soil organic matter, based on the equation Nt=No(1-e-kt)y, and validated the calculated Nt with the hot KCl extracted N.
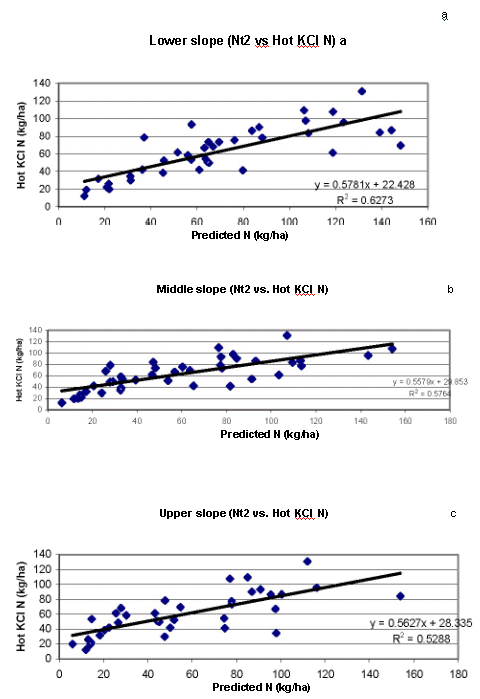
Results indicated that the potential mineralizable N released from soil differed among ecoregions and slope positions. Potential mineralizable N is lower in southern Alberta than central Alberta. The lower slopes released more N than higher slope positions. Nt released in soil over the growing season correlated well with hot KCl extracted N in three different slope positions. However, variability of Nt in the upper slope position was greater than middle and lower slopes due to a shallow A horizon and variable soil moisture during the growing season. After removal of outliers (9% of the total data set), the values of R2 (regression of hot KCl with calculated Nt) are 0.529, 0.576 and 0.627 for upper, middle and lower slope position, respectively. Using calculated Nt results, a potential mineralizable map in Alberta has been developed. This map will guide producers to manage soil as well as fertilizer N.
Introduction
Since the early 1970's, soil test nitrate nitrogen (NO3-N) has been used as a basis for N fertilizer recommendations in the prairie provinces of Canada. However, soil test NO3-N only represents nitrate N concentration at the time of soil sampling. Soil test NO3-N changes from time to time, and soil test NO3-N, therefore, does not represent the true supply power of soil N for plant uptake in a growing season.
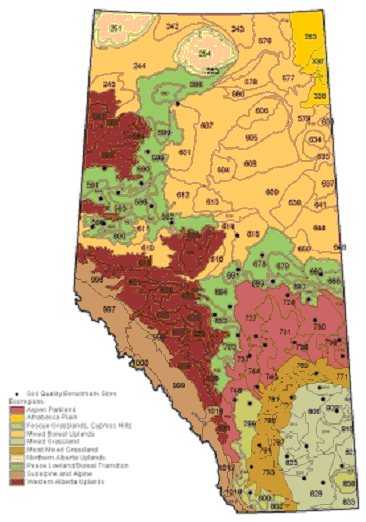
Stanford and Smith (1972) used a first order kinetics model (Nt=No(1-e-kt)) to quantify the mineralizable N in soil, where No is potential mineralizable N, Nt is mineralizable N for a given time period, k is the rate constant, and t is time. To estimate the impact of soil water content on Nt, Olness (1984) used a y factor in the above model, Nt=No(1-e-kt)y. By determining Nt experimentally, No can be obtained by graphical extrapolation. Chemical extraction is an other approach to estimate No. However, its results are still in debate due to inconsistent correlations with other reliable methods such as incubation. Nevertheless, hot KCl (35°C ) extractable N was found to be a good chemical method to estimate No in western Canada (Campbell et al., 1997). In contrast, we think that the hot KCl extracted N is Nt for a year but not No in the model. The potential mineralizable N, No is a fraction of the total organic N, and that fraction can be as high as 2.6% in prairie provinces of Canada based on historic soil test results and field experiments. Based on soil and climate, the arable area of Alberta has classified into 109 ecodistricts. In 1998, 42 benchmark sites with three slope positions were established to monitor soil quality as affected by the current agricultural practices in these ecodistricts (Figure 1).

Figure 1. Location of benchmark sites, ecoregions and ecodistricts in Alberta.
Objectives
Our objectives are 1) to evaluate hot KCl extraction as a method for soil test N; 2) demonstrate the spatial variability of mineralizable N in a field and regional scale; and 3) to estimate N mineralization rates for all the ecodistricts in Alberta's agricultural area.
Materials and Methods
Benchmark sites
Forty-two benchmarks were chosen to represent soil and agricultural practices in Alberta. Each site includes three landscape positions (upper, middle and lower). Soil samples at 0-15 cm depth were taken annually at the fall since 1998. The soil test results in 1998 are summarized in Table 1.
| Ecoregion | Available N | Available P | Available K | Available S | No.of Sites |
| | mg/kg soil |
| Aspen Parkland | 10.4 | 20.7 | 303 | 11.0 | 9 |
| Boreal Transition | 7.3 | 14.7 | 124 | 9.6 | 8 |
| Fescue Grassland | 9.2 | 18.8 | 496 | 3.1 | 2 |
| Mixed Grassland | 11.4 | 13.9 | 459 | 17.3 | 7 |
| Moist Mixed Grassland | 18.1 | 25.2 | 413 | 34.9 | 5 |
| Peace Lowland | 22.9 | 21.7 | 236 | 18.9 | 9 |
Model used
Nt = No(1-e-kt)y (Olness, 1984)
where
Nt - mineralizable N in a year mg/kg soil
No- potential mineralizable N, 2.6% of total organic N, mg/kg soil
K - rate constant, week-1
t - time, week y -moisture factor, dimensionless
We used a k value of 0.028 wk-1 derived from western Canada by Campbell et al. (1988) to calculate Nt.
Campbell et al. (1988) assigned 0.8, 0.5 and 0.2 to the moisture factor (y) from high to low soil moisture level. Beside Campbell's y values, we also calculated y through the annual precipitation divided by the optimum water required for barley growth (460 mm per year); and the cumulative precipitation from May to September divided by 460 mm. In summary, we have three methods of deriving y values: 1) Campbell's empirical values (y1); 2) annual precipitation divided by 460 mm (y2); and 3) may to September precipitation divided by 460 mm (y3). We then used the model to calculate the mineralizable N, and the calculated results were designated as Nt1, Nt2 and Nt3 for three corresponding moisture factors (y1, y2, and y3).
Results and Discussion
The R2 values from regressions of calculated Nt2 and the hot KCl extractable N was found to be significant (p<0.05) (Figure 2) for each slope position. The R2 values for Nt1 and Nt3 were similar to those reported for Nt2.
The spatial distribution of Nt2 was greater in the lower slope position as compared to the higher slope position (Table 2). The difference in N content between higher and lower slope positions is about 46 kg N/ha, a N rate nearly equal to the entire year of N application in farm land. This strongly indicates the need to adopt variable N rate management in farmland.

Figure 2. Regression of Nt2 from each slope position against hot KCl extracted N.
Table 2. Variation of Nt2 at different landscape position.
| Position | Lower Slope | Middle Slope | Upper Slope |
| | mg N kg-1 soil |
| Maximum | 5.22 | 6.26 | 6.00 |
| Minimum | 412.95 | 154.17 | 153.93 |
| Mean | 75.39 | 58.20 | 52.14 |
On a regional base, the mineralizable N is also different among the ecoregions. The Mixed Grassland , even with higher temperature, had lowest mineralizable N in soil (Table 3). The mineralizable N was highest in the Boreal Transition.
Table 3. Mean mineralizable N (Nt2) for different ecoregions.
 | Peace Lowland | Boreal Transition | Aspen Parkland | Moist Mixed Grassland | Fescue Grassland | Mixed Grassland |
 | mg kg-1 soil |
| Lower Slope | 38.49 | 65.88 | 34.08 | 25.82 | 37.86 | 10.08 |
| Middle Slope | 41.15 | 54.75 | 38.07 | 12.88 | 33.53 | 7.04 |
| Upper Slope | 57.33 | 15.22 | 28.34 | 29.00 | 3.32 | 7.16 |
Provincial maps of N mineralization estimates
To estimate the N mineralization rates for all the ecodistricts in Alberta's agricultural area, using the Nt1, Nt2 and Nt3 equations, organic carbon (OC) values and precipitation values were required for each ecodistrict. Organic matter (OM) data was obtained from the Norwest Labs Ltd. fertility database (1993-1997). Determining soil organic carbon and using the model developed in this project, mineralizable N over the growing season can be estimated. Precipitation was obtained from the AESA climate normals database (1961-1990). Both databases were developed within the AESA Soil Quality Program.
Estimates of Nt1, Nt2 and Nt3 were calculated for each slope position. Mean weighted Nt values for each ecodistrict was based on the areal extent of soil landscapes (Figures 3 to 5). This is done by using OC distribution coefficients, based on distribution and areal extent of the model soil landscape displayed in AGRASID for each ecodistrict. Potential mineralization rates ranged from 0 to 20 mg N/kg in southern Alberta but rates were over 20 mg N/kg in central and northern Alberta.
Summary
- Hot KCl extractable N is correlated to the calculated mineralizable N, Nt. Hot KCl extractable N can be used as a single soil test to predict mineralizable N in the prairie provinces of Canada. Therefore, a more realistic soil N test method can be developed for N management on arable land.
- Alternatively, determining soil organic carbon and using the model developed in this project, mineralizable N over a year can also be estimated.
Figures 3, 4 and 5. - 196K PDF. Mean weighted Nt values for each ecodistrict based on the areal extent of soil landscapes for Nt1, Nt2 and Nt3, respectively.
- Mineralizable N varied in landscape positions and ecoregions. Lower slopes released more nitrogen than upper slopes. Potential N mineralization is lower in southern Alberta compared to central or northern Alberta.
- Nt2 mineralization rates (based on annual precipitation) were higher than either Nt1 or Nt3
- Using calculated Nt results, potential mineralizable maps in Alberta have been developed. These maps will guide producers to mange soil as well as fertilizer N.
Acknowledgements
The research project is funded by Western Co-operative Fertilizers Ltd. The soil quality benchmarks are supported by the Alberta Environmentally Sustainable Agriculture (AESA) program. Soil organic matter database was provided by Norwest Labs. Germar Lohstraeter, AAFRD, contributed the mapping component of this report and the data processing required for that.
References
Campbell, C.A. et al. 1988. Can. J. Soil Sc. 68:537-552;
Campbell, C.A. et al. 1984. Can. J. Soil sci. 64:333-343;
Olness, A. 1984 Agron. J. 76:171-172;
Stanford, G. et al. 1973. Soil Sci. 115:311-323;
Stanford, G. and S.J. Smith. 1972. Soil Sci. Soc. Amer. Proc. 6:465-472.
K.R. Cannon, and T.W. Goddard
Conservation and Development Branch, Alberta Agriculture, Food and Rural Development,
#206 7000-113 St. Edmonton, Alta, Canada T5H 5T6
Mingchu Zhang and L.M. Kryzanowski
Agronomy Unit, Alberta Agriculture, Food and Rural Development, 6903-116 St., Edmonton,
Alta, Canada T6H 5Z2
R.E. Karamanos
Western Co-operative Fertilizer Ltd. Box 2500 Calgary, Alta, Canada |
|