| | Abstract | Introduction | Materials and methods | Results and discussions | Conclusions and future considerations | References
Abstract
Agricultural soils are a source as well as a sink for C. Proposed is a model to assess CO2 emissions from agricultural soils for each Ecodistrict in the white area of Alberta. Results indicate that C emissions vary with cropping and tillage systems and range from 140 to 669 kg CO2 ha-1 y-1. Annual CO2 emissions from conventional till are two times higher than from zero till systems.
Introduction
Atmospheric concentrations of greenhouse gases (GHG): carbon dioxide (CO2), nitrous oxide (N2O), methane (CH4), and chlorofluorocarbons (CFCs) have increased since the beginning of the industrial revolution. In particular, CO2 has increased from 280 parts ppm to about 356 ppm (Smith et al. 1997). Canada became a participant in the Kyoto Accord on GHG in 1997. As a participant, Canada agreed to reduce GHG emissions to 6 % below 1990 levels between 2008 to 2012 (Janzen et al. 1999). Current estimates indicate that if "business as usual" is continued, Canada will need to reduce its emissions by about 21 % for that period.
Agricultural soils are unique because they not only emit carbon (C) but they can store C in soil or vegetation. Total agricultural emissions of CO2 decreased by 13 % between 1981 and 1996. This was attributed to the conversion from conventional tillage to minimum tillage practices (Desjardins and Riznek 2000). Currently Kyoto does not include carbon sinks in the emission inventory for agriculture. If carbon sinks are accepted, emissions will be reduced from 1990 levels by 9 % in Alberta (AAFRD, 1999a).
A variety of models have been developed to estimate these long-term C changes in soil (Parton et al. 1987). Current CO2 estimates are based on the CENTURY model output from 15 % of the agricultural Soil Landscapes of Canada (SLCs) across Canada (Smith et al. 1997). However, these estimates require inputs which may not be available for all the SLCs across Alberta. The objective of this research was to develop a model to estimated current and future CO2 emissions from agriculture soils in Alberta using readily available inputs.
Materials and Methods
Norwest Labs Ltd. has collected, analyzed and recorded over 130 000 soil samples submitted to them by farmers across Alberta for fertility testing from 1993 to 1997. Using this database, in combination with AGRASID (1998), soil temperature (Atmospheric Environmental Services, 1984) and AGDATA Series (AAFRD 1999b), CO2 emissions were estimated on an Ecodistrict level.
Mean organic carbon statistics from Ecodistricts were derived from the Norwest data. Statistical analysis (Proc Univariate, SAS 6.1 for Windows) determined that organic matter values greater than 22 % were outliers and were omitted from analysis. Ecodistricts with less than 10 samples were also omitted. Organic matter (%) was converted to total organic carbon (TOC) (kg ha-1) using estimated bulk densities based on soil texture from the Land Suitability Rating System for Agricultural Crops (Pettapiece, 1995).
Model assumptions
Carbon loss from soil is emitted from two sources: 1) from the decomposition of soil C and 2) decomposition of crop residue C or other organic inputs. Therefore a 5-compartment, first order decay model consisting of two modules, the soil (S) module and residue (R) module, was developed using Stella Software, Version 3.1 to estimate C loss from agricultural soils (Figure 1). The model contained two tillage systems (conventional and zero tillage), and four cropping systems (fallow, forage, cereals, oilseeds). The following assumptions were made: (1) the soil module consists of 3-compartments representing slow, medium and fast decay; (2) the residue module consists of 2-compartments, representing slow and fast decay; (3) constant proportions of residue C or soil C are partitioned into their respective compartment; (4) each compartment has a specific decay rate (k) following first order kinetics; (5) after the residue C has decayed for 12 months, the remaining residue C is transferred into the soil module and partitioned appropriately into the three compartments; (6) forages had 80 % of aboveground biomass exported; (7) all C lost from the system was converted to CO2 (Table 1).
Figure 1: Estimate of C loss from agricultural soils using a 5-compartment first order decay model with two modules: the residue module and soil module
Table 1: Parameter Values.
| Parameter | Conventional Tillage | Zero Tillage | Reference |
| Rs | 28 % | 72 % | Campbell et al. 2000 |
| Rf | 72 % | 28 % | “ |
| Sn | 40 % | 40 % | Hyv�nen et al. 1998 |
| Sp | 45 % | 45 % | “ |
| Sj | 15 % | 15 % | “ |
| kn | 0.0000583 month-1 | 0.0000583 month-1 | McGill et al. 1981 |
| kp | 0.0014167 month-1 | 0.0014167 month-1 | “ |
| kj | 0.049 month-1 | 0.049 month-1 | “ |
| ks | 0.00675 month-1 | 0.00675 month-1 | Campbell et al. 2000 |
| kf | 0.1667 month-1 | 0.1667 month-1 | “ |
| Tillage Eff. | 80 % | 80 % | PFRA 1988 |
| C content | 45 % | 45 % | Campbell et al. 2000 |
Grain yields (kg ha-1) were estimated from AGDATA Series (AAFRD 1999b) for each Ecoregion and crop type (Table 2). The model was run for all Norwest data points within each Ecodistricts in the agricultural area. However, results from four Ecodistricts (814, 793, 727, 596) representing four Ecoregions (Mixed Grassland, Moist Mixed Grassland, Aspen Parkland and Peace Lowland) are presented here.
Table 2: Estimated Crop Biomass Inputs for Different Ecoregions.
| Grain yields (kg ha-1) |
| Ecoregion (Representative Ecodistrict) | Cereals | Oilseeds | Forages | Fallow |
| Mixed Grassland (814) | 2377 | 1703 | 1560 | 0 |
| Moist Mixed Grassland (793) | 2663 | 1405 | 1530 | 0 |
| Aspen Parkland (727) | 2471 | 1265 | 1000 | 0 |
| Peace Lowland (596) | 2586 | 1205 | 1360 | 0 |
| Proportion of root input (%) | 59 | 30 | 200 | 0 |
| Straw:grain ratio (SGR) | 1.3 | 2.2 | 1.0 | 0 |
Results and Discussions
Each Norwest soil test observation that occurred in the representative Ecodistrict with in the 93-97 period were used as initial data for individual model runs for a 5-year period. Annual C loss for each tillage system and cropping system was then predicted over 5 years. Carbon lost ranged from 789 kg C ha-1 to 3234 kg C ha-1 and was highest from the cereal cropping system (Figure 2). Similar trends were found for the other Ecodistricts. The amount of C lost tended to be greater from the conventional tillage (CT) system than the zero tillage (ZT) system for all cropping systems (Figure 3). However this trend was not statistically significant. In addition, the amount of C lost was not statistically different between cropping systems.
Decomposition of soil C or residue C results in C loss from the soil system. Emissions from residue C range from 0 to 50 % of the total C lost depending on the cropping system. (Figure 4). Therefore CO2 emission rates only consider C loss from soil. Mean annual CO2 emission rates (kg CO2 ha-1 y-1) (mean value over 5 years) indicated the same result as other values in the literature (Table 3). Annual CO2 rates increase from the Brown soil zone to the Black soil zone. Estimates by Desjardins (Ag Table 1999) were based on CENTURY output of 15 % of SLCs across Canada, and estimates by McConkey (Ag Table 1999) were based upon pooled plot data and took into consideration differences in soil texture.
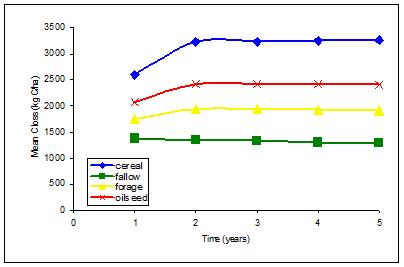 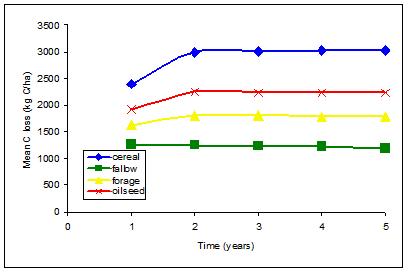
Figure 2: Annual C loss (kg C ha-1) for Ecodistrict 727 under two tillage systems over 5 years
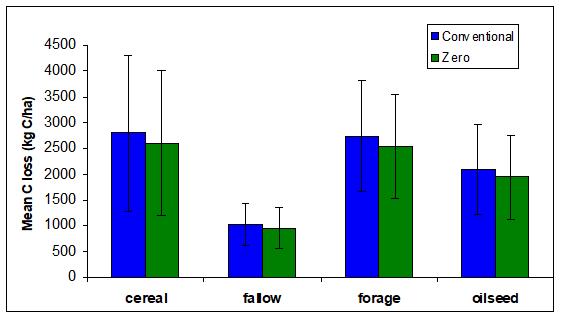
Figure 3: Mean C loss (kg C ha-1) from Ecodistrict 793 for all cropping systems after 5 years
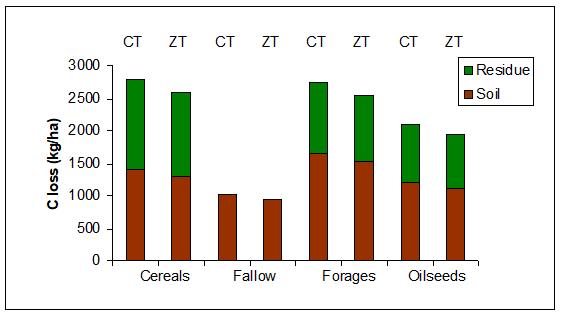
Figure 4: C loss (kg C ha-1) from the residue and soil modules for Ecodistrict 793 after 5 years
Table 3: Annual CO2 Emission Rates (kg CO2 ha-1 y-1).
| Soil Zone (Ecodistrict) | Desjardin
No Till | McConkey
No Till | Sauv� et al.
Zero Till | Sauv� et al. Conventional Till |
| Brown (814) | 410 | 367 | 157 | 170 |
| Dark Brown (793) | 550 | 733 | 140 | 152 |
| Black (727) | 760 | 1344 | 617 | 669 |
Net C gain (kg C ha-1) after 5 years was greatest in cereals (Figure 5). Net C loss was greatest from fallow systems. We did not expect net losses of C from Ecodistrict 727. However, it is higher in OM than any other Ecodistrict investigated, resulting in a higher amount of C oxidation. Smith et al. (1997) estimated SOC loss to be two to four times higher from the Black Chernozem / Luvisol orders than any other soil orders because of the high native carbon contents. Full system accounting (gains + losses) can result in a negative gain regardless of the cropping system (Figure 6).
Conventional Tillage (CT) 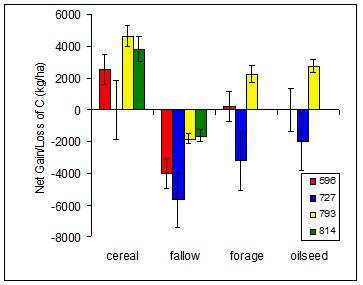 | Zero Tillage (ZT) 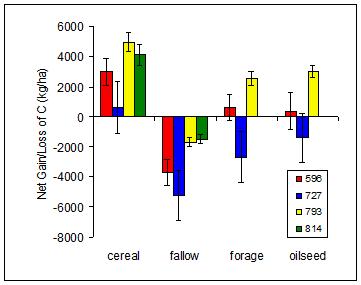 |
Figure 5: Net C gain/loss (kg C ha-1) after 5 years for all cropping systems and two tillage systems
Conventional Tillage (CT) 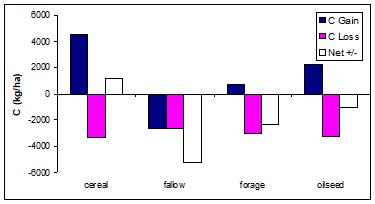 | Zero Tillage (ZT) 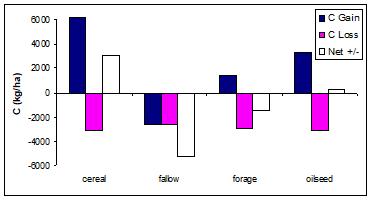 |
Figure 6: Full C accounting for Ecodistrict 727 for all cropping systems and two tillage systems after 5 years
Annual net C gain ranged from -1132 kg C ha-1 y-1 in a fallow CT system to 1183 kg C ha-1 y-1 in a cereal ZT system. One explanation for the high C gain estimate is the incorporation of 100 % of the aboveground straw biomass. Measurements of soil C gain on a continuously cropped, Orthic Grey Luvisol soil in Breton, Alberta, after 51 years was 326 kg C ha-1 y-1 (Izaurralde et al 2000). The authors estimated that over the 51-year period, export of aboveground biomass off site was 90 %. If we re-run the model assuming 80 % of the straw biomass is exported, the annual C gain predicted for the cereal ZT system is 461 kg ha-1 y-1. Therefore the high amounts of predicted C gain may be attributed to the initial assumption that all of the aboveground biomass (minus grain) was incorporated into the soil.
Conclusions and Future Considerations
Agricultural soils have the potential to sequester C. The model is sensitive to different tillage and cropping systems and different Ecodistricts. With any model, modifications are ongoing. Izaurralde et al (2000) stated that approximately 70 % of the variation in SOC gain or loss could be attributed to variations in climate and soil. Therefore, addition of soil temperature and moisture functions for each ecoregion and cropping system should be included. Also, incorporation of landscapes, improved estimates for root biomass for each cropping system and estimates for aboveground biomass export off site are needed. Izaurralde et al (2000) also stated that an additional 15 % of the variation in SOC gain or loss could be explained by rotation specific decay rates. This warrants further investigation for this model.
References
- Ag Table. 1999. Pers comm. M. Boehm June, 1999.
- AGRASID. 1998. Agricultural Region of Alberta Soil Inventory Database, Version 1.0. Alberta Agriculture, Food and Rural Development Publications.
- AAFRD, Greenhouse Gas Team. 1999a. Agriculture and Agri-Food Industry Greenhouse gas emissions in Alberta - Summary statement. pp. 8.
- AAFRD. 1999b. AGDATA Series, Statistic and data development unit, Alberta Agriculture, Food and Rural Development.
- Atmospheric Environmental Services. 1984. Canadian climate normals, volume 9- Soil temperature, lake evaporation, days with… pp.109.
- Campbell, C.A., Zentner, R.P., Liang, B.C., Roloff, G., Gregorich, E.C., and Blomert, B. 2000. Organic C accumulation in soil over 30 years in semiarid southwestern Saskatchewan - Effect of crop rotations and fertilizers. (Can. J. Soil Sci. In press).
- Desjardins, R.L., and Riznek, R. 2000. Agricultural greenhouse gas budget. In McRae, T., Smith, C.A.S., Gregorich, L.J. (eds), Environmental sustainability of Canadian agriculture: Report of agriculture environmental indicator project. Agriculture and Agri-Food Canada, ISBN 0662-28491-7.
- Hyvonen, R., Agren, G.I., and Bosatta, E. 1998. Predicting long-term soil carbon storage from short-term information. Soil Sci. Soc. Am. J. 62(4):1000-1005.
- Izaurralde, R.C., McGill, W.B., Robertson, J.A., Juma, N.G., and Thurston, J.J. 2000. Carbon balance of the Breton Classical Plots over half a century (submitted).
- Janzen, H.H., Desjardins, R.L., Asselin, J.M.R., and Grace, B. (eds.) 1999. The health of our air: Toward sustainable agriculture in Canada. Agriculture and Agri-Food Canada. pp. 97.
- McGill, W.B., Campbell, C.A., Dormaar, J.F., Paul, E.A., and Anderson, D.W. 1981. Soil organic matter losses. In Agricultural land, our disappearing heritage. Proceedings from 18th Annual Alberta Soil Science Workshop, Edmonton, p 30-48.
- Parton, W.J., Schimel, D.S., Cole, C.V., and Ojima, D.S. 1987. Analysis of factors controlling soil organic matter levels in Great Plains grasslands. Soil Sci. Soc. Am. J. 51:1173-1179.
- Pettapiecce, W.W. 1995. Land suitability rating system for agricultural crops 1. Spring-seeded small grains. Agriculture and Agri-Food Canada, Technical Bulletin 1995-6E. pp.90.
- Prairie Farm Rehabilitation Administration (PFRA). 1988. Alberta soils at risk - again: Results of a soil survey. SAS Institute Inc. 1999. Version 6.12. Cary, NC: SAS Institute Inc.
- Smith, W.N., Rochett, P., Monreal, C., Desjardins, R.L., Pattey, E., and Jaques, A. 1997. The rate of carbon change in agricultural soils in Canada at the landscape level. Can. J. Soil Sci. 77(2):219-229.
This paper was presented at the Alberta Soil Science Workshop in 2000. The complete project report is available.
Prepared by:
Jilene L. Sauv�, Tom W. Goddard, and Karen R. Cannon |
|