| |

The 2017 Crop Season | Insects and Crop Diseases | Pasture and Forage | Alberta Crop Production, 2017 | Alberta Forage Production, 2017 | Alberta Crop Production Tables | Precipitation Map
Overview
This report presents a review of the crop season in Alberta and an analysis of crop production statistics for 2017. In addition, a precipitation map for the 2017 crop season is attached for reference.
The 2017 Crop Season
The season started with wet a spring and unharvested crops from the previous season. Seeding was challenging and somewhat delayed, especially, for producers in the North East, North West and Peace Regions. In general, weather conditions during the season were not uniform across the province and resulted in variable seeding and harvest progress, yields and crop quality.
More specifically, seeding was slow at the beginning of the season, due to the cool April temperatures experienced throughout the province. The situation was even worse in the northern parts of the province, where cool temperatures slowed the dry down of already saturated soils caused by wet conditions in fall of 2016. Surface soil moisture condition at the beginning of May was reported as seven per cent fair, 26 per cent good, 44 per cent excellent and 23 per cent excessive. Regionally, excessive soil moisture was rated at three per cent in the Southern Region and nine per cent in the Central Region. For the Northern parts of Alberta, it was much higher at 49 per cent in the North East Region, 43 per cent in the North West Region and 25 per cent in the Peace Region. Fall seeded crops emerged from the winter with 89 per cent rated provincially as good or excellent and 11 per cent fair.
Saturated soils throughout the North East, North West and Peace Regions continued to slow field operations over May. Also, showers and rainfall, especially, in the western parts of the province hampered seeding operations. By the end of May, seeding progress in Alberta was 79 per cent complete, which was well behind the 5-year provincial average (2012-2016) of 97 per cent. Crop stage development was also behind normal, as only 43 per cent of crops emerged, compared to 78 per cent in 2016. Surface soil moisture improved slightly and was reported as one per cent poor, eight per cent fair, 40 per cent good, 36 per cent excellent and 15 per cent excessive, as of May 30. As well, good to excellent pasture conditions remained dominant, with ratings of nine per cent fair, 69 per cent good and 22 per cent excellent, as of May 30. Regionally, no rating fell below 85 per cent good or excellent.
The delay in seeding and unfavourable weather conditions changed seeding intentions for producers who started to shift their acres to barley, away from spring wheat, canola and field peas in the first week of June. By mid-June, about 96 per cent of crops across the province were seeded and 86 per cent had emerged. Seeding in the Southern and Central Regions was complete, while seeding progress was 97 per cent in the North East, 95 per cent in the North West and 78 per cent in the Peace Regions, as of June 13. By the end of June, crop development was in line with the long term averages for the Southern Region and Central Region, marginally delayed in the North East Region and well behind in the North West Region and Peace Region, due to late seeding. Precipitation was variable across the province in June, but provincial crop growing conditions remained above normal in this month. Crop growing conditions as of June 27 was rated as 78 per cent good or excellent, up five per cent from the 5-year average.
Hot and dry weather settled in most parts of the province at the beginning of July, with some areas in the Southern Region experiencing high temperatures. Highly variable precipitation across the province also resulted in crop conditions starting to deteriorate. Hot, dry weather continued throughout the Southern Region and broadened its hold in the Central Region. Precipitation in July was highly variable across the province. While most of the areas in the Peace Region and northern parts of the North East Region and North West Region saw at least near normal precipitation, the rest of the province remained quite dry. Consequently, surface soil moisture was highly variable across the province. Provincial surface soil moisture was reported as 47 per cent good or excellent, with 13 per cent excessive, by the end of July. Regionally, surface soil moisture was rated as poor or fair for 83 per cent of the Southern Region and 48 per cent of Central Region, while it was good or excellent for more than 50 per cent in the northern Regions. Excessive soil moisture was reported 34 per cent in the North East Region, 32 per cent in the North West Region and 6.0 per cent in the Peace Region. Wet conditions and excessive soil moisture in the northern parts and dry conditions in the southern parts of the province resulted in deteriorating crop growing conditions, with only 60 per cent of crops rated as good or excellent by July 25, compared to the 5-year average of 74 per cent. The initial crop yield estimates by the end of July indicated that the provincial yield index was 98.9, down 1.1 index points from the 5-year average.
Dry conditions in southern parts of the province continued into the month of August, contributing to an early harvest. Harvest progress by the end of August stood at 18 per cent provincially, largely due to advances in the Southern Region (52 per cent) and Central Region (14 per cent). Following a wet spell from spring, some drier weather started to prevail by mid-August in the North East Region, North West Region and Peace Region, allowing some crop maturity. Even so, harvest progress was behind in these regions, with only three per cent of crops harvested in the North East Region, less than one per cent in the North West Region and seven per cent in the Peace Region, as of August 29.
Scattered rain across the province in August was too light and variable, to significantly improve soil moisture and crop conditions, especially, in the Southern Region and Central Region. By the end of August, surface and sub-surface soil moisture, as well as pasture growth conditions reflected the effects of the continuing dry conditions in southern parts of the province. Surface soil moisture was reported as 28 per cent poor, 23 per cent fair, 24 per cent good, 18 per cent excellent and seven per cent excessive. Pasture growth conditions was rated as 32 per cent poor, 26 per cent fair, 28 per cent good and 14 per cent excellent.
Warm and dry conditions prevailed across the province until mid-September, allowing provincial harvest progress to advance 45 per cent. Regionally, by September 12, harvest progress had advanced about 36 per cent in the Southern Region and 35 per cent in the Central Region, while it was in line with the 5-year averages in the North East Region and behind about eight and 18 per cent in the North West Region and Peace Region, respectively. After mid-September, cooler weather moved into the province, resulting in frost in most areas. There was also precipitation, especially, in the North West Region and Peace Region, which slowed down harvest progress. By the end of September, 99 per cent of the crops in the Southern Region, 76 per cent in the Central Region, 32 per cent in the North East Region, 14 per cent in the North West Region and 40 per cent in the Peace Region were in the bin, with quality better than what was anticipated earlier in the season.
Cold and wet weather remained dominant in October, bringing killing frost to almost all areas in the province and some harvest challenges for the northern parts. Despite the unfavourable weather, producers were still able to make some harvest progress which stood at 87 per cent by mid-October. Producers in the North East, North West and Peace Regions also had to contend with wet snow up to six inches, which flattened standing cereal crops and required some drying after harvest. Overall, the dryland yield index for the province was estimated at 97.8 per cent by October 17, while crop quality deteriorated, reflecting the effect of a slow harvest, but still higher than the 5-year averages.
As of October 31, harvest was provincially complete across the province, with 98.6 per cent of crops in the bin. The final estimate for the provincial dryland yield index was 97.4 per cent, down 2.6 per cent from 5-year averages. Dryland yields for the Southern Region were below the 5-year averages, while for the Central Region, those were in line with the 5-year averages. For the northern regions, dryland yields were above the 5-year averages. Crop quality was also variable across the province. Provincially, crop quality for the top two grades of hard red spring wheat, durum wheat, malt barley, canola and dry peas were above their 5-year averages. Quality for barley number one and the top two grades of oats were below the 5-year averages. About 86 per cent of hard red spring wheat graded in the top two grades, up 10 per cent from the 5-year average. About 85 per cent of durum wheat graded number 2 or better, up 14 per cent from the 5-year average. About 25 per cent of barley was eligible for malt (up six per cent from the 5-year average) and 58 per cent graded as number 1 (down six per cent from the 5-year average). About 54 per cent of oats graded in the top two grades, down 19 per cent from the 5-year average. Almost 87 per cent of harvested canola graded as number one (up five per cent from the 5-year average), with 10 per cent graded as number 2 (down two per cent from the 5-year average). About 87 per cent of dry peas graded in the top two grades, up 13 per cent from the 5-year averages.
Insects and Crop Diseases
In 2017, populations of pea leaf weevil, cabbage seedpod weevil and lygus were generally lower than previous years. Both grasshoppers and wheat stem sawfly population were higher than normal. Potato psyllids were present for most of the growing season, with a peak in August. In southern Alberta, concerns about insects was not huge until July when a very large outbreak of diamondback moth occurred. Wheat midge was an issue in some parts of the Central Region.
Pasture and Forage
The season started with 72 per cent of hay and pasture rated as good or excellent, with very good moisture. However, growth was slow, due to cool temperatures. The good to excellent situation remained dominant until mid-July, when dry conditions blanketed southern parts of the province. After this, pasture conditions deteriorated for the rest of the season. As of August 22, pasture conditions were reported as 29 per cent poor, 23 per cent fair, 31 per cent good and 17 per cent excellent. Dry conditions in the southern parts of the province coupled with wet conditions in the northern parts affected pasture growing conditions in a way such that by the end of October, provincially, only 28 per cent of pasture was rated as good to excellent, 28 per cent poor and 44 per cent fair. Some precipitation in early fall improved pasture growing conditions in the Southern Region to 32 per cent good or excellent. For the other regions, the comparable rating was 10 per cent in the Central Region, 20 per cent in the North East Region, 15 per cent in the North West Region and 78 per cent in the Peace Region.
After several years, dry conditions in the southern parts of the province were favourable for haying operation. First cut dryland hay (5-year averages shown in brackets) was 97 (89) per cent complete by August 8, with an average yield of 1.6 (1.5) tons per acre and quality rated at 82 (67) per cent good or excellent. Irrigated haying operations were 99 (99) per cent complete, with average yield at 2.8 (2.3) tons per acre and quality rated at 92 (71) per cent good or excellent. As of September 19, the average yield for second cut hay was 1.1 tons per acre for dryland, and 1.8 tons per acre for irrigated. Some producers even had a third cut of irrigated hay, with the average yield at 1.3 ton per acre. The quality for second cut hay was reported as 64 and 93 per cent good to excellent for dryland and irrigated hay, respectively. The quality of third cut hay was rated as 100 per cent good to excellent.
Alberta Crop Production, 2017
Total 2017 Crop Production
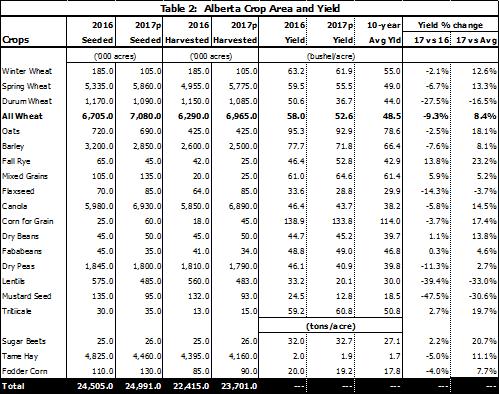
On December 6, 2017, Statistics Canada released its final 2017 estimates of crop production for Canada and provinces. Production of selected field crops (including forages) in Alberta totalled 33.5 million tonnes, down 2.4 per cent from a year ago. Excluding forages, selected field crops production was at 24.8 million tonnes, 0.8 per cent lower than last year (see Table 1). It is important to note that although estimates were lower for 2017, they are still 13.6 and 17.8 per cent higher respectively, than the 10-year averages (2007-2016). Provincial average yields for most major crops fell from 2016, but were still higher than the 10-year averages (see Table 2). Total seeded areas of principal field crops increased 2.0 per cent from 2016, while total harvested area was up 5.7 per cent, due to the lower harvested area in 2016 as a result of the challenging harvest season.
2017 Production by Crop Type
Total production of spring wheat in 2017, increased 9.1 per cent, to 8.7 million tonnes, second highest on record. The higher production stemmed from an increase in harvested area (up 16.5 per cent) compensating for the decline in yield (down 6.7 per cent). The provincial average yield was estimated at 55.5 bushels per acre, with harvested area at 5.8 million acres. Durum wheat production decreased 31.6 per cent, to 1.1 million tonnes, due to a 5.7 per cent drop in harvested area to 1.1 million acres, as well as a 27.5 per cent decline in average yield from last year, to 36.7 bushels per acre. For all wheat, production slightly increased by 0.8 per cent, to 10.0 million tonnes. The higher production was due to harvested area increasing 10.7 per cent to 7.0 million acres, despite a 9.3 per cent decline in yields, to 52.6 bushels per acre.
Total barley production fell 11.2 per cent from last year to 3.9 million tonnes. The average yield was down 7.6 per cent to 71.8 bushels per acre, while harvested area declined 3.8 per cent to 2.5 million acres.
Total canola production increased 10.9 per cent from 2016 to a record of 6.8 million tonnes. This was attributed to a higher harvested area of 6.9 million acres (up 17.8 per cent from 2016), despite average yield falling 5.8 per cent, to 43.7 bushels per acre.
Dry peas production fell 12.3 per cent to 2.0 million tonnes, due to a lower yield of 40.9 bushels per acre (down 11.3 per cent from 2016) and harvested area of 1.8 million acres (down 1.1 per cent). Despite the production decline, it was still the second highest on record and 76.2 per cent above the 10-year average.
Total oats production dropped 2.5 per cent, to 609,200 tonnes, due to a 2.5 per cent decrease in yield to 92.9 bushels per acre. Harvested area remained unchanged at 425,000 acres.
Corn for grain production increased significantly, by 140.8 per cent to a record of 152,900 tonnes (63,500 tonnes in 2016) and was 185.9 per cent above the 10-year average. The higher production was driven by a 150.0 per cent increase in harvested area (to 45,000 acres), while yield decreased 3.7 per cent to 133.8 bushels per acre.
Lentils production fell to 264,400 tonnes (down 47.8 per cent from 2016), which is the second highest on record but still 86.1 per cent above the 10-year average. The decline was a result of a 13.8 per cent drop in harvested area (to 483,000 acres), and a 39.4 per cent decrease in yield (to 1,207 pounds per acre).
For sugar beets, production increased 6.3 per cent to 771,100 tonnes. The higher production was the result of a 4.0 per cent increase in harvested area to 26,000 acres, and a 2.2 per cent increase in yield to 32.7 tons per acre.
2017 Crop Production, Canada
Total 2017 Canadian production was 22.2 million tonnes for spring wheat, 5.0 million tonnes for durum, 3.7 million tonnes for oats, 7.9 million tonnes for barley, 21.3 million tonnes for canola, and 4.1 million tonnes for dry peas.
Alberta Forage Production, 2017
Based on the Statistics Canada report “Production of Principal Field Crops, December, 2017”, forage production (fodder corn and tame hay) for Alberta in 2017 decreased 6.6 per cent from a year earlier, to 8.7 million tonnes. This was attributed to a lower production of tame hay, despite fodder corn production increasing. Fodder corn production increased 1.5 per cent to 1.6 million tonnes, driven by a 5.9 per cent increase in harvested area, which more than offset a four per cent decline in yield. For tame hay, production was down 8.2 per cent to 7.2 million tonnes, due to a lower harvested area and yield. The average yield for tame hay slipped 5.0 per cent to 1.9 tonnes per acre, while harvested area fell 5.2 per cent, to 4.2 million acres.
Based on a survey conducted by the Statistics and Data Development Section of Alberta Agriculture and Forestry, total greenfeed production in the province fell 26.6 per cent from 2016, to 770,598 tonnes (Table 3), mainly due to a 23.0 per cent decrease in average provincial yield to 2.81 tonnes per acre. Also, harvested area decreased 4.7 per cent. Total silage production was estimated at 2.5 million tonnes, down 5.9 per cent from 2016. Driving the loss was 5.4 per cent decrease in the average provincial yield to 6.21 tonnes per acre, as well as 0.5 per cent decrease in harvested area.
Total area harvested for greenfeed and silage declined 2.3 per cent in 2017 to 678,313 acres (See Figure 1). Greenfeed harvested area fell 4.7 per cent to 274,562 acres, while silage acreage declined by 0.5 per cent to 403,751 acres. Just to caution, data for the 2017 survey was collected in mid-October, when farmers still did not have a very good idea about the harvest season and as such, there could be a revision in the acreages.
Contacts
For additional information relating to this report, please do not hesitate to contact the author.
This report is also available on the Internet at:
http://www1.agric.gov.ab.ca/$department/deptdocs.nsf/all/sdd4191
Alberta Agriculture and Forestry
Economics and Competitiveness Branch
Statistics and Data Development Section
Ashan Shooshtarian
Crop Statistician
780-422-2887
Email: ashan.shooshtarian@gov.ab.ca
March 27, 2018
Alberta Crop Production Tables

Precipitation Map for the 2017 Crop Season
Source: Alberta Agriculture and Forestry, Environmental Stewardship Branch, Engineering and Climate Services Section
 |
|